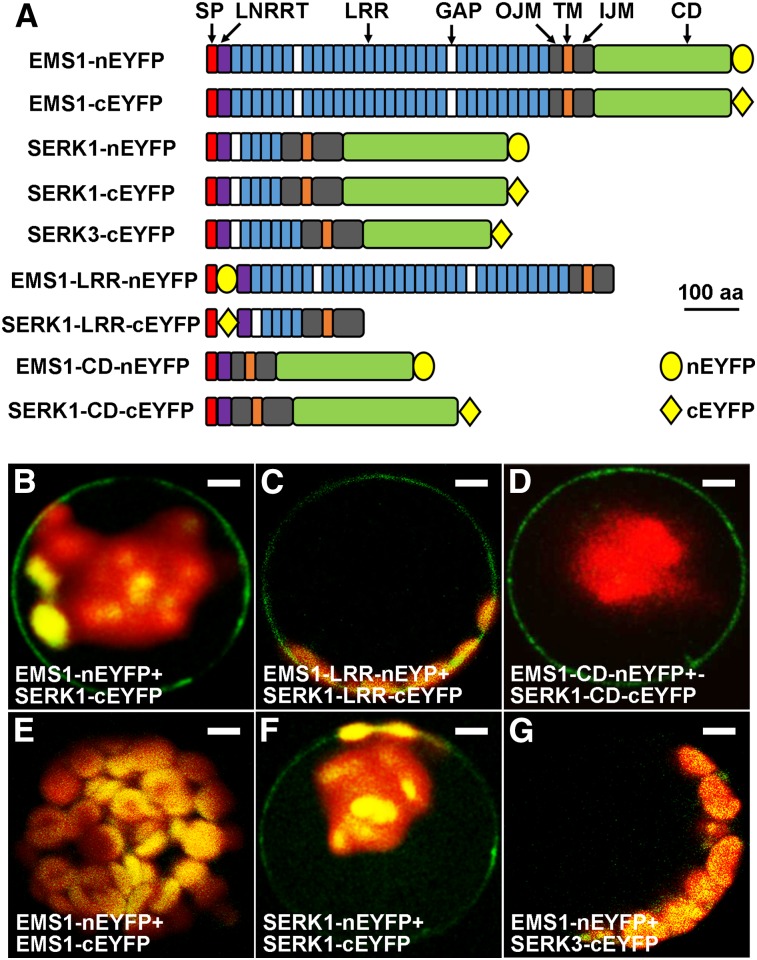
Figure 2.
BiFC results showing that SERK1 interacts with EMS1 via LRR and kinase domains. A, Schematic diagrams showing EMS1, SERK1, and SERK3 (control) primary structures as well as truncated versions for BiFC assays. SP, Signal peptide; LRRNT, LRR-containing N terminus; GAP, non-LRR gap region between two LRRs; OJM, outer juxtamembrane domain; TM, transmembrane domain; IJM, inner juxtamembrane domain. All constructs contain SP, OJM, TM, and IJM domains. Yellow ovals represent the N-terminal EYFP (nEYFP), and yellow diamonds represent the C-terminal EYFP (cEYFP). The size bar (aa = amino acids) only indicates sizes of EMS1, SERK1, and SERK3 but not nEYFP or cEYFP. B, Confocal image showing that the full-length EMS1 interacts with the full-length SERK1 at the plasma membrane. C and D, Confocal images showing that EMS1 interacts with SERK1 at the plasma membrane via their LRR domains (C) and kinase domains (D). E, Confocal image showing no EMS1-EMS1 interaction. F, Confocal image showing that SERK1 interacts with itself at the plasma membrane. G, No interaction between EMS1 and SERK3 (control). Bars = 10 µm.

