Figure 2.
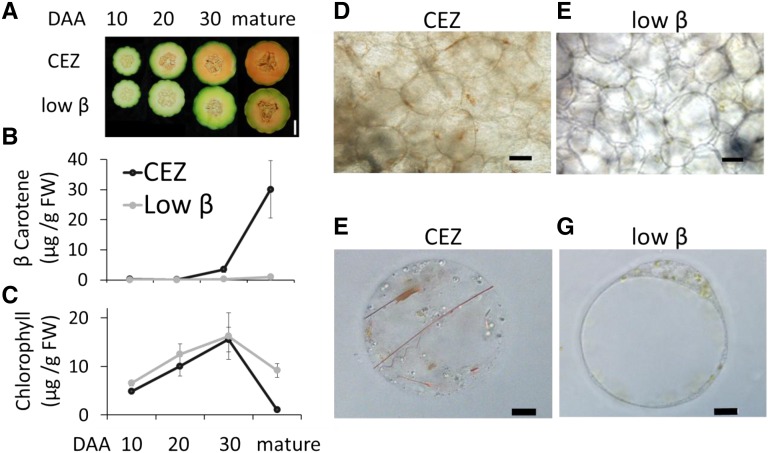
Phenotypes of low-β mutant and CEZ fruits. A, Cross sections of low-β and CEZ fruits at four developmental stages: 10, 20, and 30 d after anthesis (DAA) and mature stage. Bar = 5 cm. B, Fruit flesh β-carotene levels in the four fruit developmental stages shown in A. Data are means ± sd of three biological replicates (different fruits from different plants). FW, Fresh weight. C, Total fruit chlorophyll a and b levels during fruit development. D and E, Bright visible light microscopy of mature fruit mesocarp cells of CEZ (D) and low-β (E). Bars = 100 μm. F and G, Bright-field light microscopy images of mature CEZ protoplast (F) and mature low-β protoplast (G). Bars = 10 μm.

