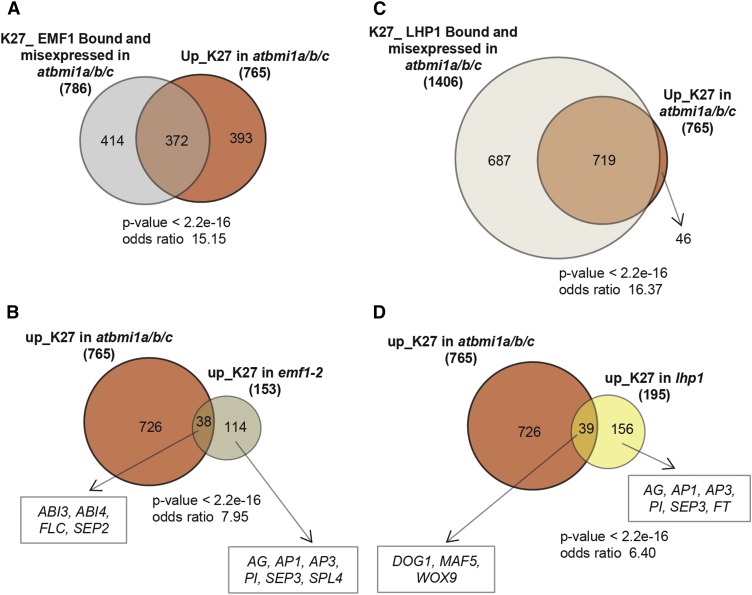
Figure 6.
AtBMI1, EMF1, and LHP1 regulatory networks. A, Comparison of genes H3K27me3 marked bound by EMF1 and misexpressed in atbmi1a/b/c and with genes up_K27 in atbmi1a/b/c. B, Venn diagram showing up_K27 genes in atbmi1a/b/c and emf1-2. C, Comparison of genes H3K27me3 marked bound by LHP1 and misexpressed in atbmi1a/b/c and with genes up_K27 in atbmi1a/b/c. D, Venn diagram showing up_K27 genes in atbmi1a/b/c and lhp1. Some overlapping and nonoverlapping representative genes are indicated. All these overlaps are significant (P values and Fisher’s exact test results are indicated).

