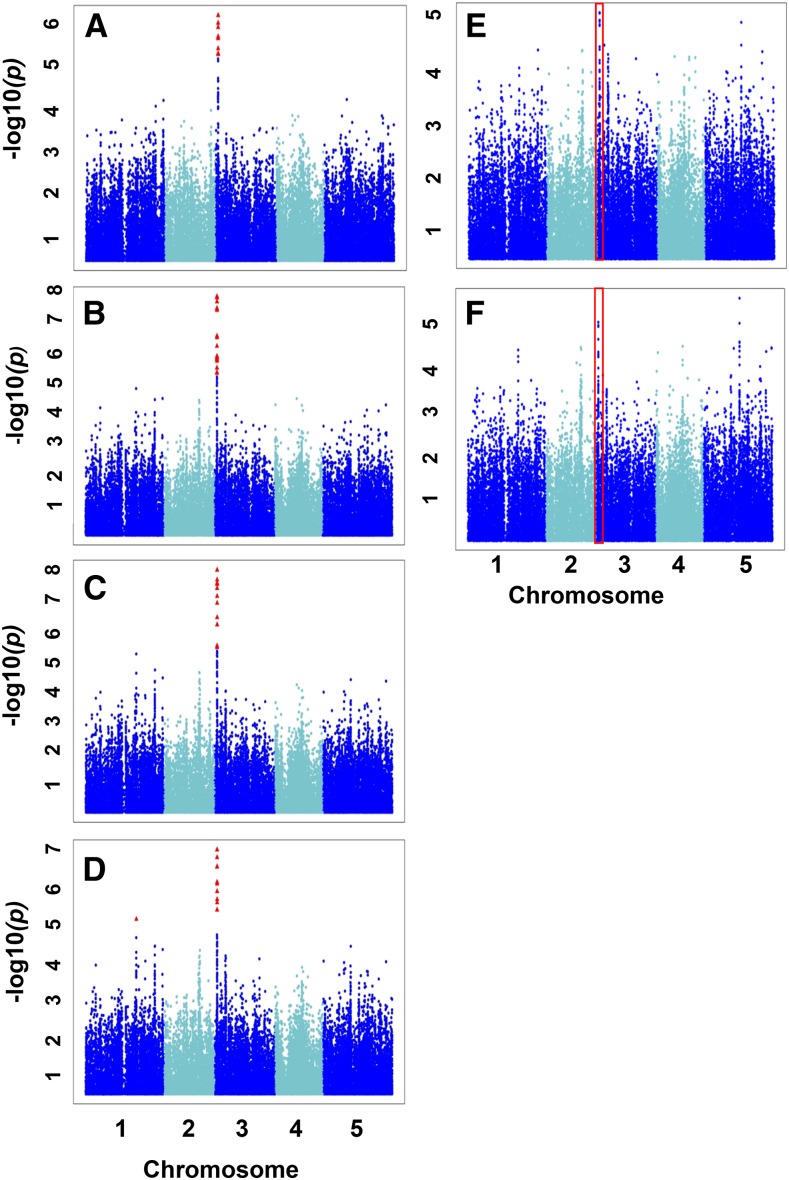
Figure 3.
GWAS for the His-related traits from the two approaches. Scatterplots show the association results from a unified mixed model analysis for H/KHR (A), H/KHSQR (B), H/KHSQRV (C), H/LIVKHQSR (D), H/EHPRG (Glu family; E), and H/total (F) traits across the five Arabidopsis chromosomes. The negative log10-transformed P values from the GWAS analysis are plotted against the genomic physical position. P values for SNPs that are statistically significant for a trait at 5% FDR are in red. Traits A through D share a similar significant GWAS signal on chromosome 3. Red boxes represent the corresponding chromosomal region of this signal for traits E and F.

