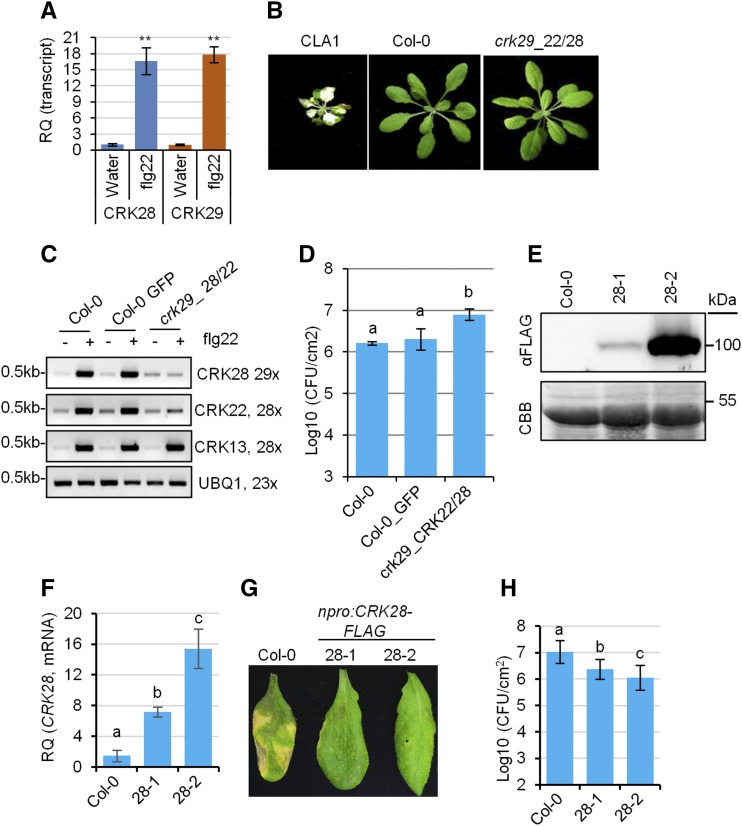
Figure 2.
Genetic investigation of CRK-mediated responses to P. syringae. A, qPCR analyses of CRK28 and CRK29 transcripts after treatment with the bacterial elicitor flg22. RQ, Relative quantification. Col-0 was treated with flg22 or water, and rosette leaves were collected 3 h later for RNA extraction and cDNA synthesis. Expression was normalized to Arabidopsis ELONGATION FACTOR1α (EF-1α; AT5G60390). This experiment was repeated three times with similar results. Error bars indicate sd (n = 4). Statistical differences were detected by Fisher’s lsd, α = 0.01. Asterisks indicate statistically significant differences. B, Phenotypes of 4-week-old VIGS-silenced Arabidopsis lines. Cloroplastos alterados 1 (CLA1)-silenced plants were used as a control for silencing efficiency. C, RT-PCR analyses of VIGS efficiency. Expression data were normalized to Arabidopsis UBIQUITIN EXTENSION PROTEIN1 (AT3G52590). Leaves of 4-week-old VIGS-silenced plants were treated with or without flg22 for 1 h before RNA extraction and RT-PCR analyses. D, Quantification of bacterial titers in crk29-1 plants silenced for CRK22 and CRK28 3 d post syringe infiltration with Pst DC3000. Col-0 plants infiltrated with VIGS constructs carrying GFP were included as a control. Error bars indicate sd; n = 3. Statistical differences were detected by Fisher’s lsd, α = 0.05, and letters indicate significant differences. This experiment was repeated twice with similar results. E, Anti-FLAG immunoblot showing protein level expression of CRK28 in two lines expressing CRK28 genomic DNA (npro:CRK28-FLAG 28-1 and 28-2) in the crk28-1 T-DNA mutant. The bottom gel shows the membrane stained with Coomassie Brilliant Blue (CBB) to indicate protein loading. F, qPCR analyses of CRK28 expression in Col-0, 28-1, and 28-2. Data were analyzed as described in A. G, Increased expression of CRK28 enhances Arabidopsis resistance to Pst strain DC3000. Four-week-old Col-0 and npro:CRK28-FLAG expression lines were syringe infiltrated with Pst DC3000, and leaves were photographed 4 d post infiltration. H, Bacterial titers in Col-0 and npro:CRK28-FLAG expression lines 4 d post syringe infiltration with Pst DC3000 at the indicated levels (colony-forming units [CFU] mL−1). Error bars indicate se; n = 6. Statistical differences were detected by Fisher’s lsd, α = 0.01, and letters indicate significant differences. This experiment was repeated four times with similar results.

