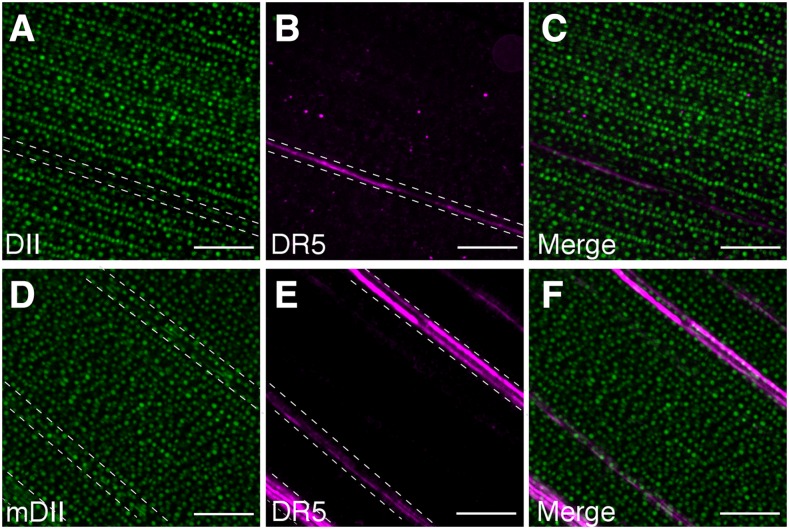
Figure 2.
DII and mDII signal near vasculature in the leaf blade. Maximum Z-stack projections of fluorescence of epidermal and vasculature cells from leaf sections of DII (A), DR5 (B), merged DR5 and DII (C), mDII (D), DR5 (E), and merged DR5 and mDII (F). Bar = 100 μm. For fluorescence intensity quantification, random positions within the dashed lines were taken and compared with fluorescence in the leaf epidermis (region outside of the dashed line region).

