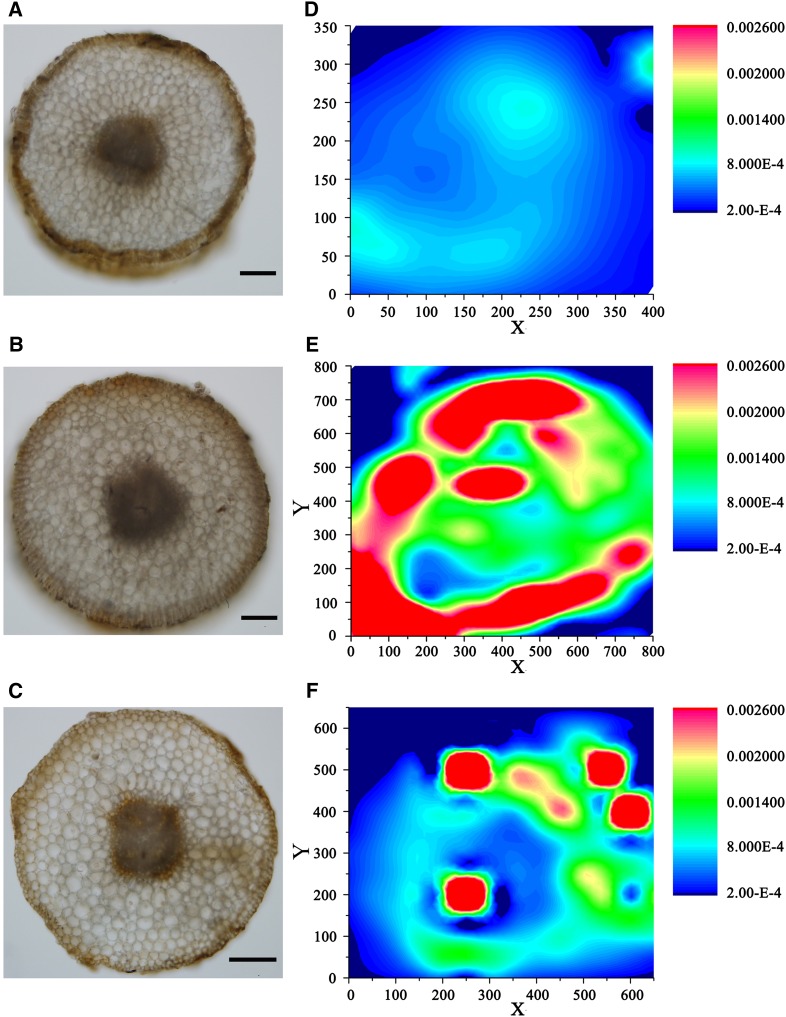
Figure 1.
XRF microtomography showing that the Fe content is higher in M. xiaojinensis roots than in M. baccata roots. Qualitative spatial distribution and concentration gradients of Fe in latitudinal sections of (A and D) M. baccata (sufficient Fe supply, 40 μm Fe2+), (B and E) M. xiaojinensis (sufficient Fe supply, 40 μm Fe2+), and (C and F) M. Xiaojinensis roots (deficient Fe supply, 0 μm Fe2+). Bar color (blue to red) reflects Fe contents (low to high). The SR-μXRF signals for the map were collected in 50-μm steps. The areas mapped for A and D, B and E, and C and F were 350 μm × 400 μm, 800 μm × 800 μm, and 650 μm × 650 μm, respectively. Scale bars in A, B, and C indicate 50 µm, 100 µm, and 100 µm, respectively.

