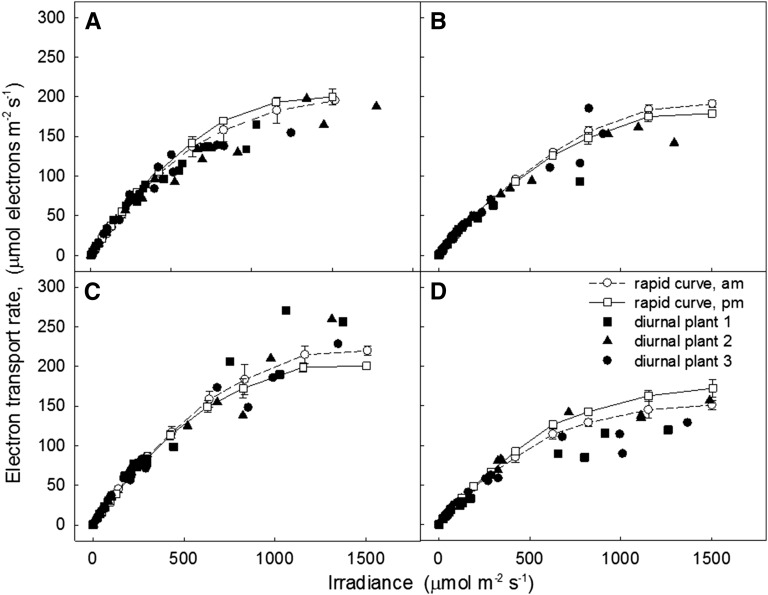
Figure 4.
The relationship between electron transport and irradiance, measured with Walz Monitoring PAM, diurnally (black symbols) and with conventional light response curves (white symbols), on leaf 8 for four genotypes: Azucena (A), MAGIC, IR77298-14-1-2-10 (B), Moroberekan (C), and IR64-21 (D). Measurements in Azucena and MAGIC were made at 70 DAS on November 3, 2014 (A and B), and in Moroberekan and IR64-21 at 72 DAS on November 5, 2014 (C and D). Conventional and diurnal response is collected with the method described in Figure 2.

