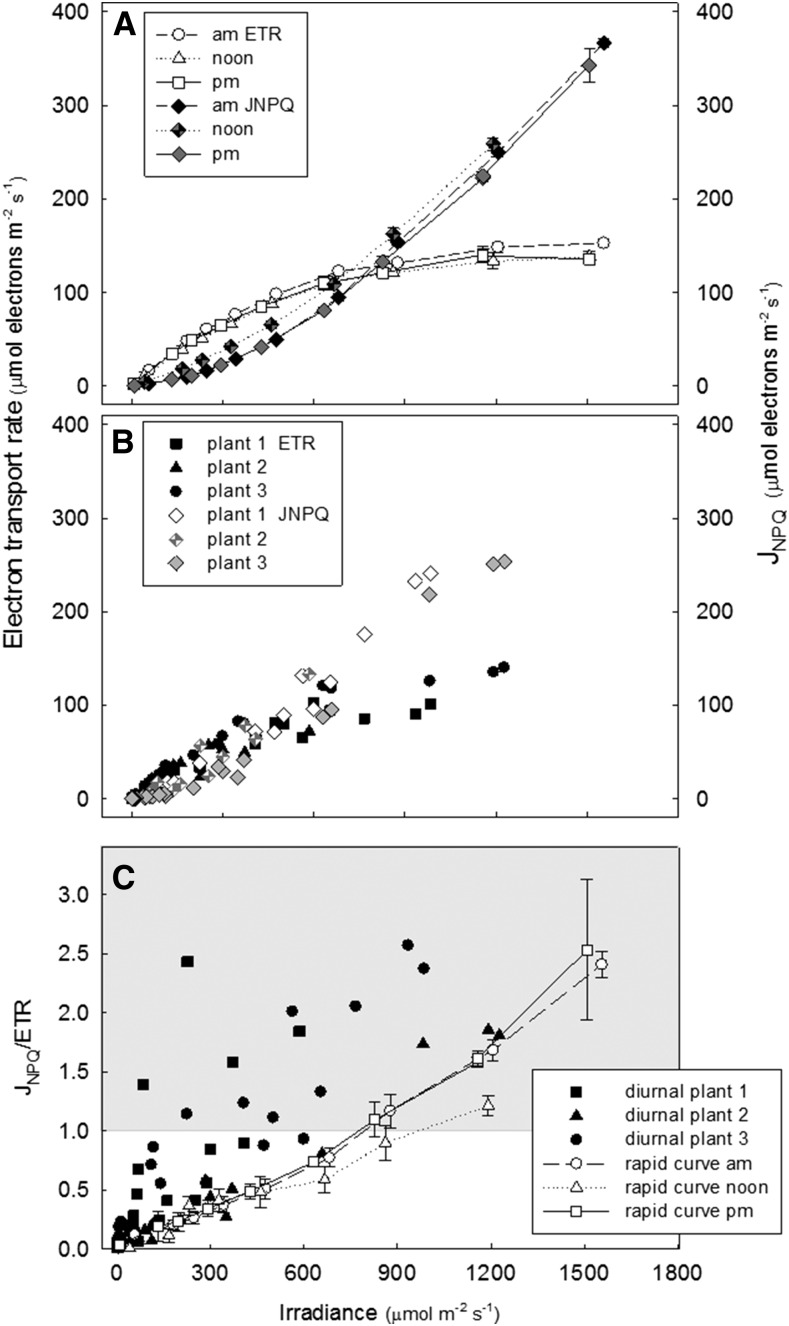
Figure 7.
A and B, ETR and JNPQ response to irradiance, calculated with Equations 2 and 5, respectively, from conventional light response curves in the morning, noon, and afternoon (A) and diurnally with saturating flashes made at 30 min intervals as a function of solar irradiance with Walz Monitoring PAM (B). Measurements were made on leaf 13 of cv Nipponbare at 122 DAS (n = 3). C, The ratio of JNPQ/ETR at a given irradiance calculated for the diurnal and conventional response curves in the same leaves. The shaded area begins where JNPQ/ETR = 1 and signifies where JNPQ becomes greater than ETR.

