Figure 4.
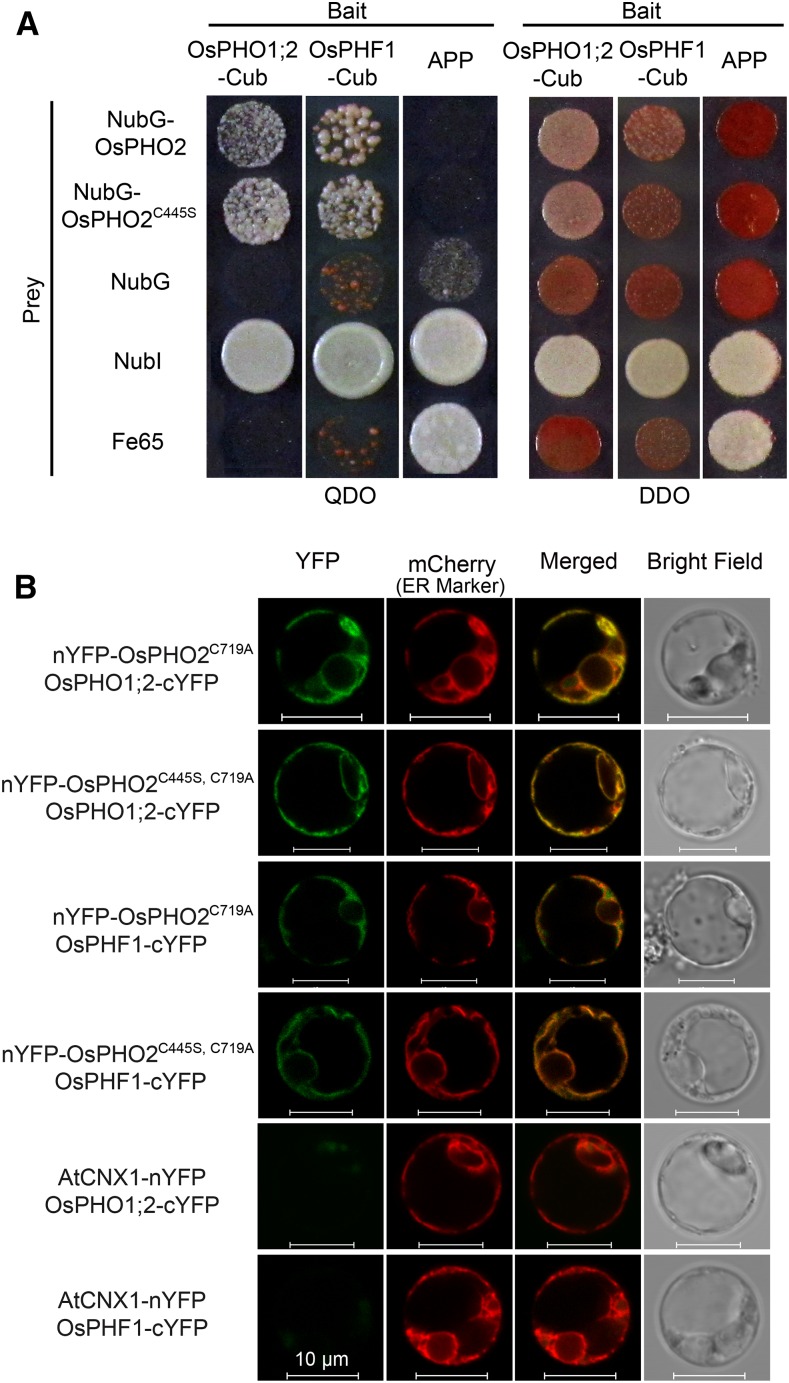
OsPHO2 interacts with OsPHO1;2 and OsPHF1. A, Split-ubiquitin Y2H analysis of the interaction between OsPHO2/OsPHO2C445S and OsPHF1/OsPHO1;2. Coexpression of NubI or NubG with OsPHO1;2 or OsPHF1 was used as positive and negative controls, respectively. Also, the bait APP served as a control that could interact with NubI and Fe65, but not with NubG and NubG-OsPHO2. QDO, SD/-Leu-Trp-His-Ade; DDO, SD/-Leu-Trp. B, BiFC visualization of the interaction between OsPHO2 and OsPHF1/OsPHO1;2 in rice pho2 protoplasts. Coexpression of AtCNX1-nYFP and OsPHF1-cYFP or OsPHO1;2-cYFP served as negative controls. The ER marker was AtWAK2-mCherry. Bars = 10 μm.

