Figure 1.
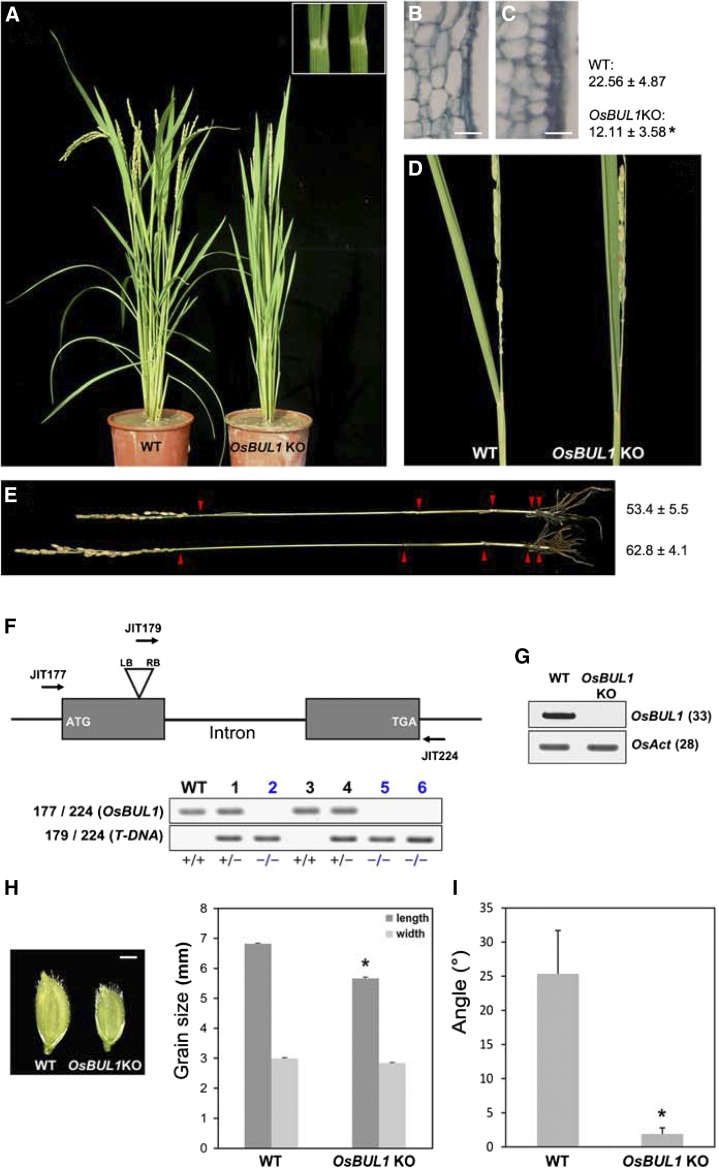
OsBUL1 null mutants show erect leaves. A and D, OsBUL1 knockout mutant plants exhibit erect leaves. The lamina joint area of the second leaf from the wild type (left) and OsBUL1KO is shown in the box (A). B and C, Comparison of cells in the lamina joint area by longitudinal sections in wild-type (B) and OsBUL1KO (C) plants. Length of cells in the lamina joint of wild-type control and OsBUL1KO plants is presented. Values are given as means ± sd (µm; n > 12; *P < 0.01, Student’s t test). Bar = 20 µm in B and C. E, Mild reduction of plant height by retarded elongation of lower internodes is observed in OsBUL1KO plants (top). Arrowheads indicate each node of plants, and plant height of each genotype is presented as means ± sd (cm, n > 12). F, OsBUL1KO plant is a T-DNA insertion mutant, and #2, #5, and #6 plants are OsBUL1 KO homozygous plants. Genotyping primers were as follows: (JIT177) 5′-GGAATTCATGTCGAGCAGAAGGTCGTCGCGTG-3′, (JIT179) 5′-CCACAGTTTTCGCGATCCAGACTG-3′, and (JIT224) 5′-CGCTTGCTGCTGCTGCTTGCCGATC-3′. +/+ Means wild type/wild type segregant, and +/− and −/− indicate heterozygote and homozygote for T-DNA insertion, respectively. G, OsBUL1 transcripts are not detected in OsBUL1KO plants. The numbers in the parentheses indicate PCR cycles. H, The mutant plants produce smaller grains. Bar = 2 mm. Error bars indicate sd (n = 30; *P < 0.0001, Student’s t test). I, Leaf angles between wild-type and OsBUL1KO plants. The third leaf from the top of the main stem was used for measurement and values are given as means ± sd in the graph (n = 18; *P < 0.001, Student’s t test).

