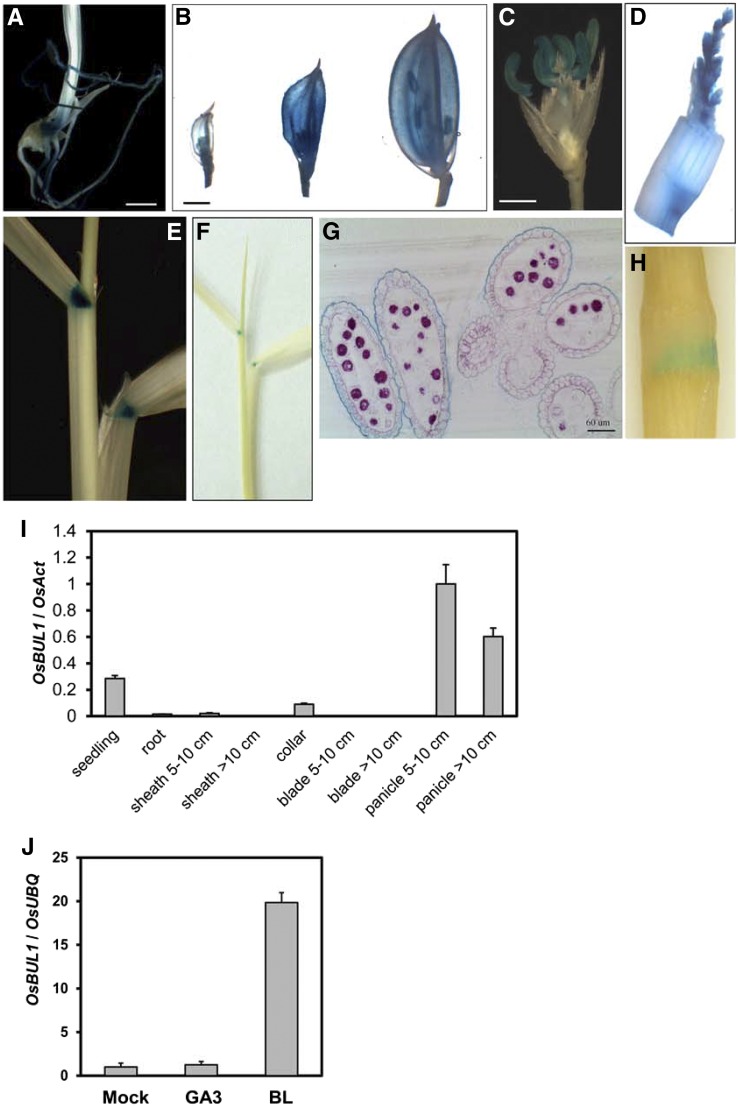
Figure 3.
Spatiotemporal expression of OsBUL1. A to H, GUS staining of various tissues from pOsBUL1:GUS transgenic rice plants: seedlings (A), spikelets with different developmental stages (B), a spikelet after removing palea and lemma (C), young panicle (D), lamina joint (E and F), anthers (G), and node (H). Bar = 1 mm in A to C. I, Relative expression level of OsBUL1 in various organs at different developmental stages. J, Induction of OsBUL1 expression by GA3 and BL at the 24-h time point after treatment. Error bars indicate sd of three biological replicates.

