
FIGURE 2.
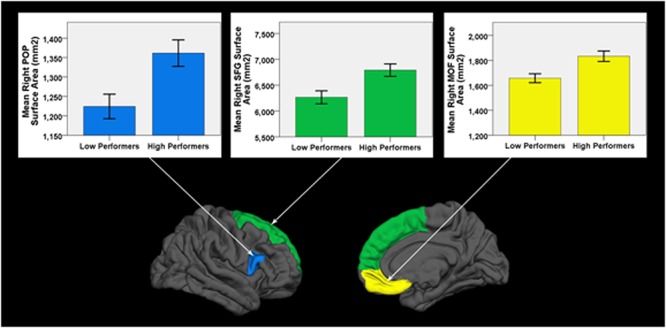
Cortical surface differences between low versus high working memory performers. Arrows connect graphs of between group differences to the affiliated gyri ROI highlighted on a FreeSurfer brain model. POP, pars opercularis of the inferior frontal gyrus; SFG, superior frontal gyrus; MOF, medial orbital frontal gyrus. Error bars = ± 1 SE.