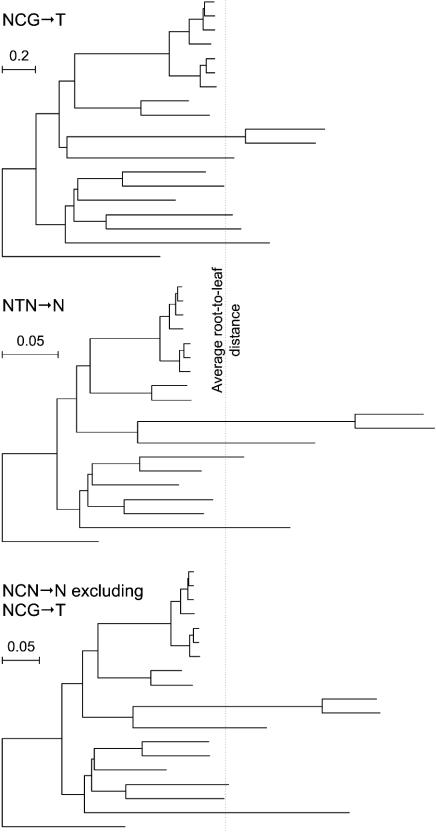
Fig. 6.
Tree shape varies according to substitution type, with NCG→ T the most clock-like. Branch lengths indicate the expected number of substitutions of the indicated types per pertinent site. Branch-length values with 95% confidence intervals for each substitution type and for all types combined are given in Figs. 11–25, which are published as supporting information on the PNAS web site. The trees are scaled so that the average root-to-leaf distance (indicated by the vertical line) is the same for all trees. See Fig. 1 for species labels.

