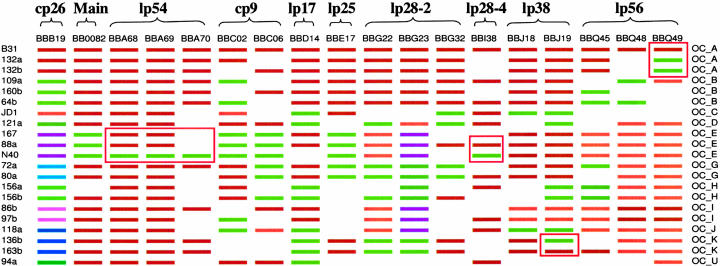
Fig. 2.
Multilocus sequence types of the three genomes and 18 clinical isolates. For each gene (column), colors represent various major-group alleles. Blank spaces indicate that data were not obtained because of either a lack of amplification or multiple amplicons in PCR. Isolates of the same ospC types (labeled on the right) share alleles across all surveyed loci except at loci enclosed in the red boxes, to which divergent alleles were introduced by recent genetic exchange.

