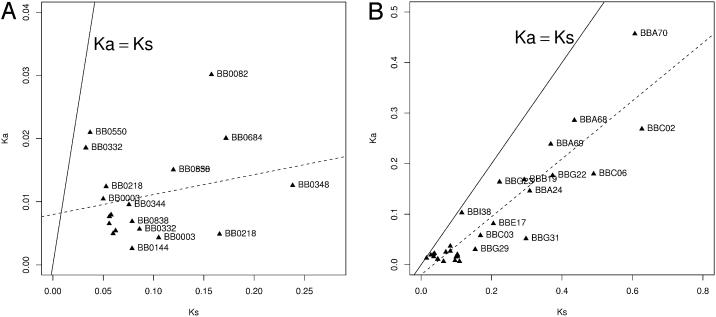
Fig. 3.
Rates of synonymous and nonsynonymous substitutions in HDNP ORFs. Ka vs. Ks of HDNPs between B31 and N40 are shown. (A) Chromosomal HDNPs. ORFs are mostly far below the Ka = Ks neutrality line (solid line) and there is no Ka ≈ Ks correction (regression line in dashes; R2 not significant), indicating strong selective constraints on amino acid substitution. (B). Plasmid HDNPs. ORFs are closer to the Ka = Ks neutrality line and Ka is strongly correlated (R2 = 0.83, P « 0.001) with Ks, likely resulting from balancing selection. Note the difference in scale between A and B.

