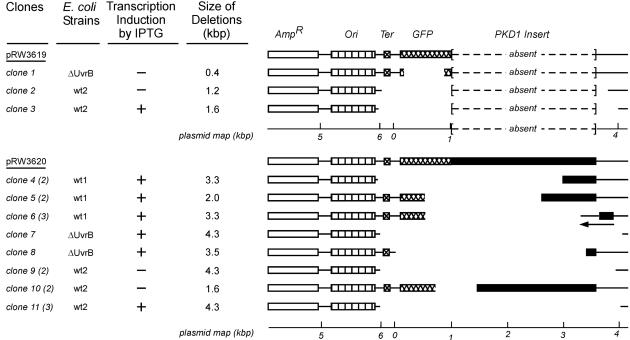
Fig. 2.
Restriction mapping studies of the mutant white CFUs. The first column lists the individual clones; the numbers of clones with identical restriction patterns are given in parentheses. The second column provides the E. coli host strains before the plasmids were isolated and retransformed in the ΔUvrB strain. The third column indicates whether transcription was induced by IPTG. The fourth column indicates the size of the deletions. A schematic representation of the mutations is provided on the right. The space between segments indicates the size and location of each deletion. The symbols designating the regions of DNA are as in Fig. 1.

