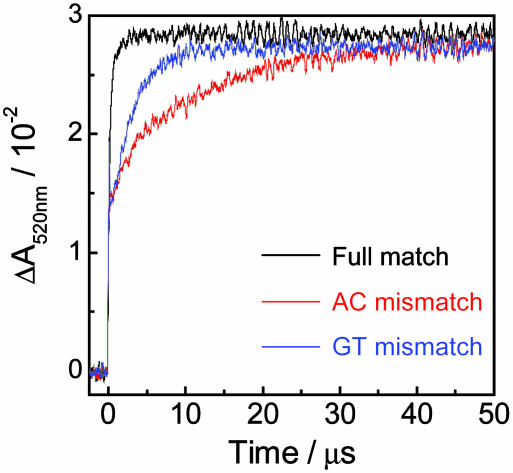
Fig. 6.
Time profiles of the transient absorption at 520 nm assigned to PTZ•+ for DNA conjugates containing A·C (red) and G·T (blue) mismatch. For comparison, the time profile for the (GA)6 sequence, which is same as these conjugates except for the mismatch site, is shown (black). Sample solution contained 100 μM duplex DNA, 20 mM sodium phosphate buffer (pH 7.0), and 100 mM sodium chloride.

