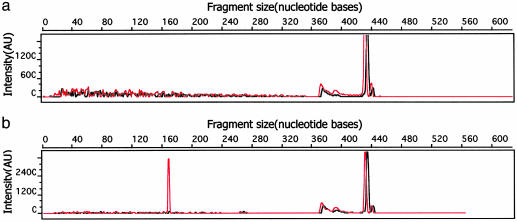
Fig. 3.
Representative capillary electrophoresis traces demonstrating the detection of an SNP within a plasmid. The red trace represents the forward strand and the black trace corresponds to the reverse strand. (a) When a homozygous template, in this case, the homozygous plasmid A, is tested by the assay procedure, no cleaved products are detected. The full-length PCR product, 436 bases in length, is present. (b) When two templates, here G and C plasmids, are mixed, denatured, and reannealed to generate a heterozygous site, mismatches are generated. After photocleavage for 30 min at 442 nm with 500 nM Rhchrysi, and fluorescently tagging, the cleaved product, 170 bases in length, is evident (see Materials and Methods). The horizontal scale shows the fragment size in units of nucleotides. The vertical scale is fluorescent signal intensity in arbitrary units. We ascribe the small peak, ≈320 bases in length, to overloading of the sample.

