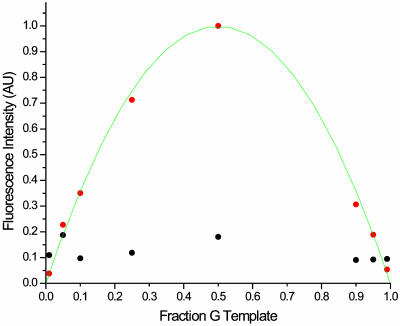
Fig. 4.
A plot showing the effect of varying the allele frequency on the fluorescent intensity of the cleaved products. The fraction of G template added to C template was varied over a range of 0.01–0.99 to imitate the effect of varying the allele frequencies on this assay. This fraction of G, which may be thought of as an allele frequency, is plotted on the horizontal axis. The normalized fluorescence intensity of the cleaved peak is plotted in red. The normalized background peak intensity is plotted in black. All fluorescence measurements are normalized to the uncleaved parent peak intensity. For fractions of 0.05 or greater, the cleaved peak exceeds background and can therefore be detected as an SNP. A line consistent with a fit to the statistical mixture is included to guide the eye.

