Fig. 4.
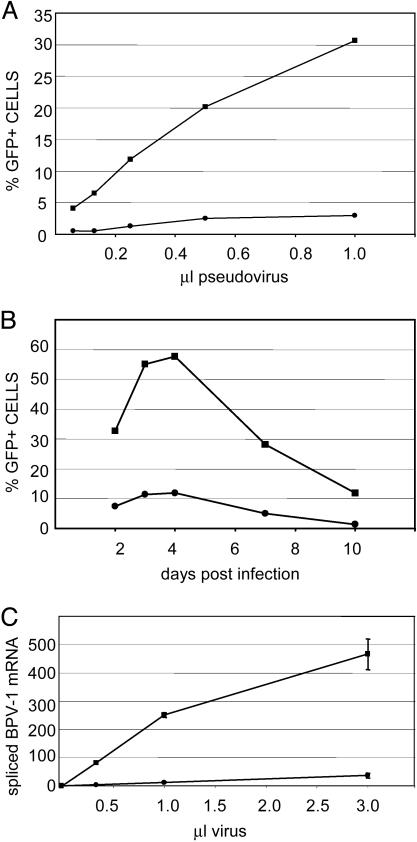
PML–/– cells are neither efficiently transduced by PV pseudovirus nor infected with BPV virions. (A) The transduction of the PML–/– cells, Hemp (closed circles), or PML3-expressing transfectants, HP3 (closed squares). BPV L1 + L2 pseudovirus with a packaged GFP expression plasmid was added to cells for 48 h (1.0 μl of pseudovirus stock is equivalent to 200 ng of particles). GFP expression was determined by flow cytometric analysis. Marker boundaries were set such that untransduced control cells showed <1.0% fluorescent cells. Shown is a representative experiment of five separate experiments performed on different days. B shows the real-time QRT-PCR analysis quantifying the spliced E5 mRNA. BPV1 virions, derived from bovine warts, were added to cells for 72 h. RNA was extracted and analyzed by a real-time QRT-PCR assay specific for spliced mRNAs from nucleotides 2505–3225, as described in Materials and Methods. Quantities of mRNA are expressed as femtogram of the DNA standard. Each data point is the average of three independent infections. The results with the Hemp cells are designated with closed circles and those of the HP3 cells with closed squares (1.0 μl of virus stock is equivalent to 250 ng of particles). (C) The time course of PV pseudovirus transduction of Hemp or HP3 cells. GFP expression driven from the plasmid packaged in BPV L1 + L2 pseudovirions was monitored for 10 days postinfection. Pseudovirions were added to cells. Cells were harvested at the indicated day and processed for flow cytometric analysis. Marker boundaries were set such that untransduced control cells showed <1.0% fluorescent cells.

