Figure 3.

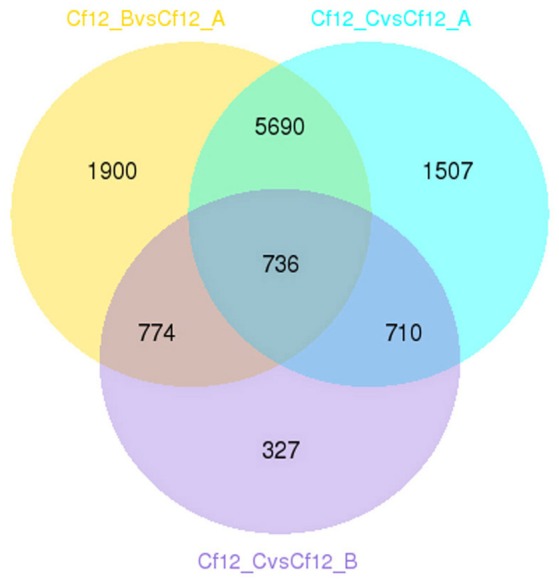
Venn diagram of the relationship between DEG groups. The numbers indicate the DEG number in each DEG group shown in Table S5.

Venn diagram of the relationship between DEG groups. The numbers indicate the DEG number in each DEG group shown in Table S5.