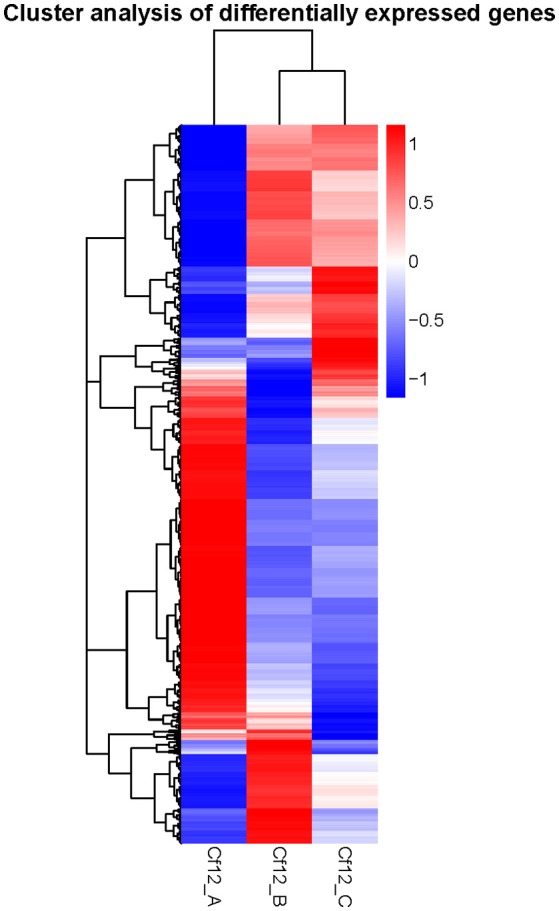
Figure 4.

Hierarchical clustering of DEGs. The blue bands indicate low gene expression quantity, and the red bands represent high gene expression quantity.

Hierarchical clustering of DEGs. The blue bands indicate low gene expression quantity, and the red bands represent high gene expression quantity.