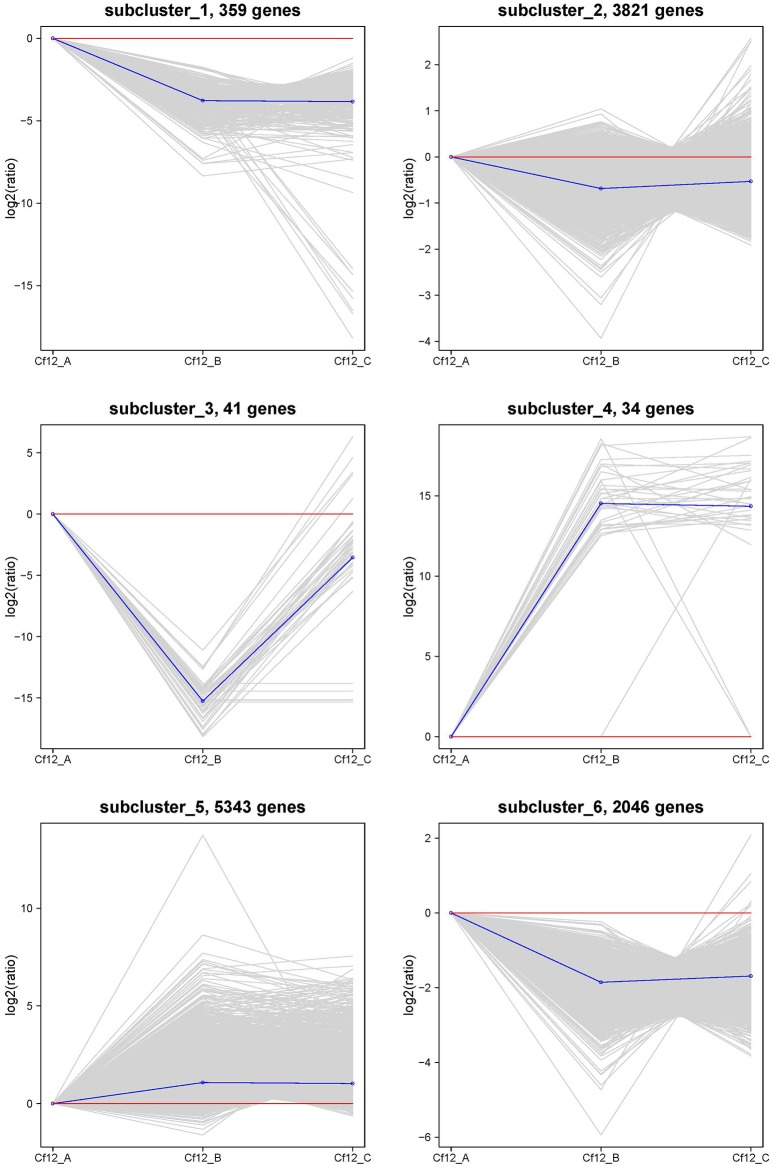
Figure 5.
The clustering of DEGs expression patterns. The six expression patterns of DEGs obtained by K-means clustering algorithm is shown, which are represented as upregulated (subcluster_4 and subcluster_5), transient (subcluster_3), and downregulated (subcluster_1, subcluster_2, and subcluster_6). Expression ratios are expressed as Log2.

