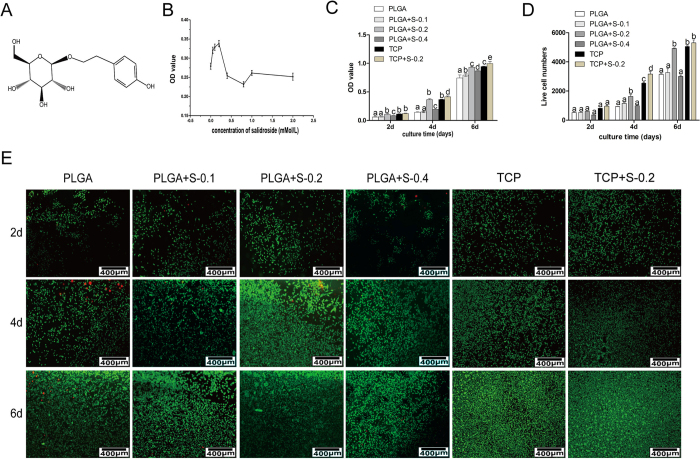
Figure 1. Effects of SDS on RSC 96 via MTT analysis in vitro.
(A) Chemical structure of salidroside; (B) Preliminary drug screening analysis of RSC 96 treated on PLGA scaffold with different concentrations of salidroside after 3 days (n = 3, mean ± SEM); (C) Proliferative effects of salidroside on RSC96 on PLGA scaffold measured by MTT assay (n = 3, mean ± SEM). Different letters denote significances with P < 0.05 and the same letter shows no significant differences (P ≥ 0.05); (D) Quantitative data of the mean number of SCs. Data of each bar are shown as the mean of three independent experiments ± SD. Different letters denote significances with P < 0.05 and the same letter shows no significant differences (P ≥ 0.05); (E) Cell viability was measured by FDA/PI staining under microscope. (PLGA means cultured with 0 mM SDS, PLGA+S-0.1 means cultured with 0.1 mM SDS, PLGA+S-0.2 means cultured with 0.2 mM SDS, PLGA+S-0.4 means cultured with 0.4 mM SDS, TCP means cultured on TCP alone, TCP+s-0.2 means cultured with 0.2 mM SDS on TCP).

