. 2016 Dec 13;5:e22757. doi: 10.7554/eLife.22757

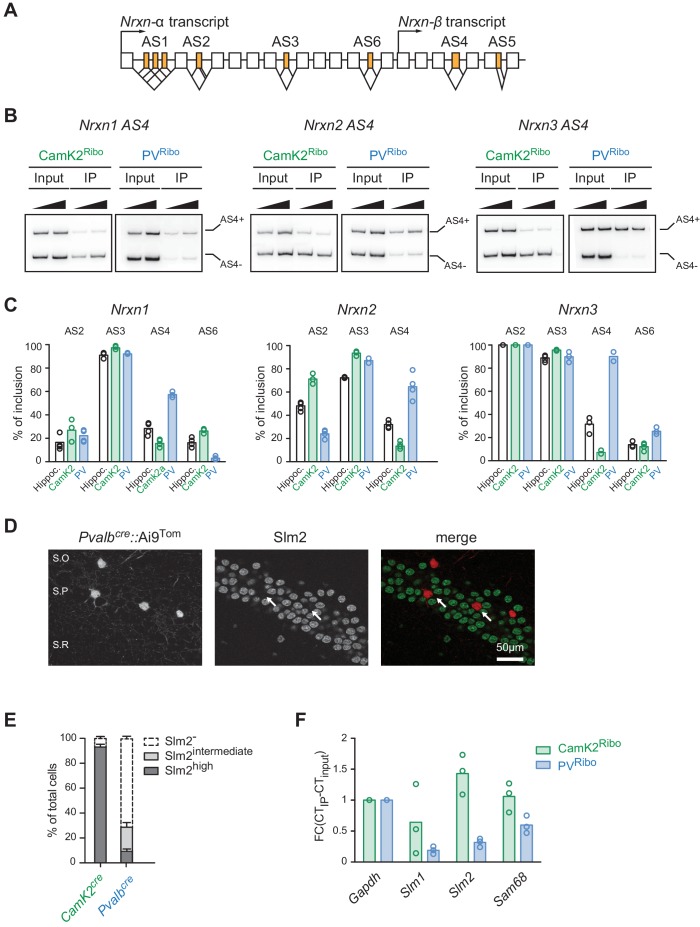
Figure 2. Cell type-specific alternative splicing.

(A) Schematic illustrating exon-intron structure of the Nrxn gene (example based on mouse Nrxn1). Alternatively spliced segments are numbered (AS1-6) and alternative exons are highlighted in orange, constitutive exons in white. (B) Analysis of alternative splicing pattern in total hippocampus (input), Camk2Ribo and PVRibo preparations. Radioactive PCR amplifications for Nrxn1,2,3 AS4. For each sample two PCR reactions with increasing cDNA input are shown. (C) Quantifications of alternative exon insertion rates at alternatively spliced segments (AS) 2,3,4, and six in Nrxn1,2,3 transcripts for total hippocampus (input), CamK2Ribo and PVRibo preparations. The insertion rates were measured by radioactive PCR with limiting cycle numbers. Raw data for the radioactive PCR amplifications are shown in Figure 2—figure supplement 1 (n= 3-4 independent mRNA preparations). (D) Expression of Slm2 in PV+ cells in mouse hippocampus (postnatal day 25–30) was examined using Pvalbcre::Ai9Tom mice. Dual immunohistochemistry on vibratome sections reveals high Slm2 expression in hippocampal pyramidal cells but no detectable expression in the majority of PV+ cells in and adjacent to the stratum pyramidale (S.O: stratum oriens, S.P: statrum pyramidale, S.R: stratum radiatum). (E) Quantification of the percentage of CamK2Ribo and Pvalbcre::Ai9Tom positive cells that show specific Slm2 immunoreactivity. (n = 5 mice for CamK2Ribo with a total of 2312 cells and five mice for Pvalbcre::Ai9Tom with a total of 244 cells, mean + SEM). (F) mRNA expression of STAR-family RNA-binding proteins was assessed by real-time qPCR in CamK2Ribo and PVRibo mRNA preparations (n = 3 independent mRNA preparations).

DOI: http://dx.doi.org/10.7554/eLife.22757.005

Figure 2.

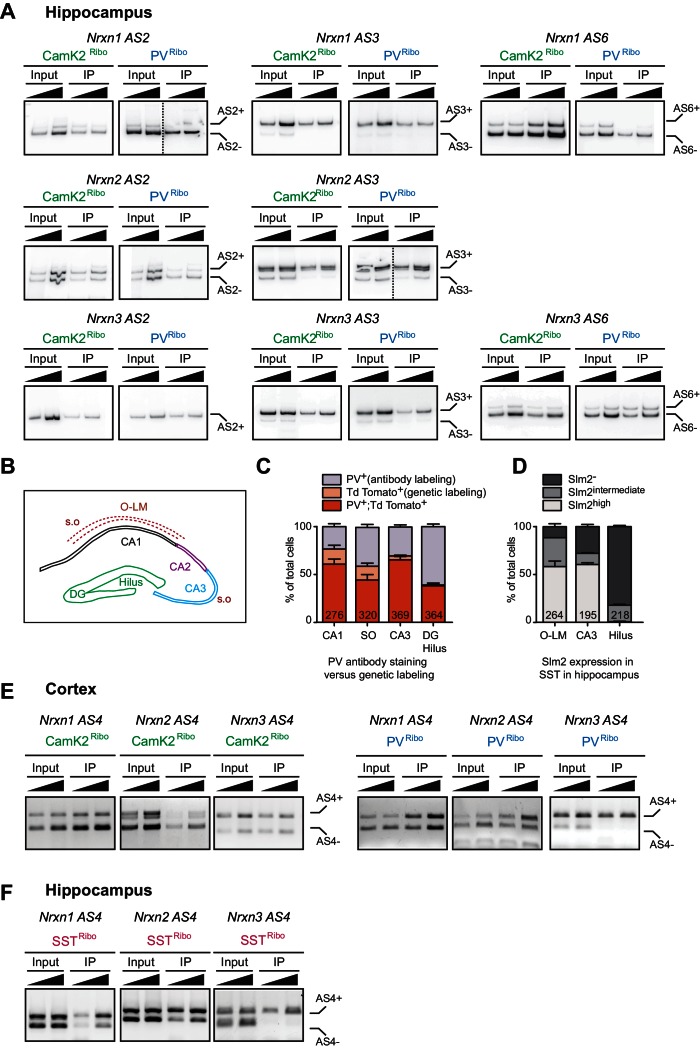
Figure 2—figure supplement 1. Assessment of alternative exon incorporation rates by radioactive PCR.

Figure 2—figure supplement 1.

(A) Neurexin alternative exon incorporation rates in total hippocampus (input) versus CamK2Ribo and PVRibo immunoisolations (IP). Insertion rates were measured by radioactive PCR with limiting cycle numbers. Amplification products for two different cDNA amounts are shown for each sample. Note that for Nrxn3 AS2, single band PCR represents Nrxn3 AS2+ isoform (determined by the PCR band size). Dotted lines represent two independent experiments that were combined. (B) Schematic representation of the different hippocampal areas (S.O: stratum oriens, O-LM: oriens-lacunosum moleculare,DG: dentate gyrus). (C) Quantification of number of Pvalbcre::Ai9Tom positive cells which show PV immunoreactivity and/or which are genetically labelled with Td Tomato (n = 5 mice. The total number of cells is indicated in the graph bars, mean + SEM). (D) Quantification of number of Somatostatincre::Ai9Tom positive cells which show specific Slm2 immunoreactivity (n = 5 mice. The total number of cells is indicated in the graph bars, mean + SEM). (E) Neurexin alternative exon incorporation rates at AS4 determined for CamK2Ribo and PVRibo mRNA isolations in the neocortex by standard PCR amplification. (F) Neurexin alternative exon incorporation rates at AS4 determined for SSTRibo mRNA isolations from hippocampus analyzed by standard PCR amplification (Somatostatincre::Rpl22-HA).
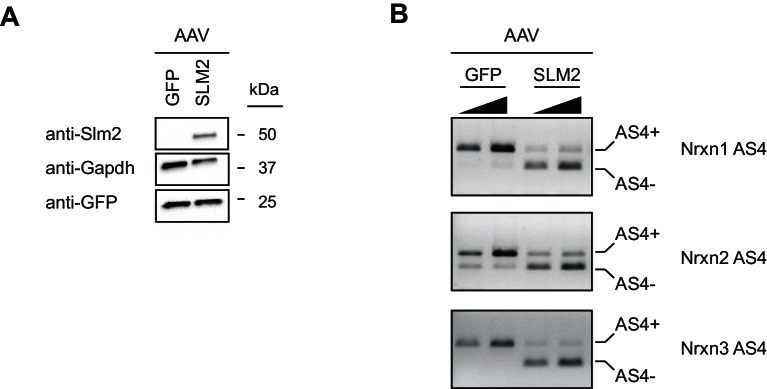
Figure 2—figure supplement 2. Ectopic expression of Slm2 is sufficient to drive expression of Nrx AS4- isoforms.

Figure 2—figure supplement 2.

(A) Detection of Slm2 level in cerebellar granule cells infected with AAV-GFP or AAV-Slm2-2A-Venus YFP by Western blotting analysis. Cerebellar granule cells do not express Slm2. The cultures were infected at day in vitro three and the samples were harvested at day in vitro 14. (B) The presence of Slm2 in cerebellar granule cells cultures induces the expression of Neurexin AS4- isoforms. The alternative exon incorporation choice is revealed by standard PCR amplification. For each sample two PCR reactions with increasing cDNA input are shown.