. 2016 Dec 13;5:e22757. doi: 10.7554/eLife.22757

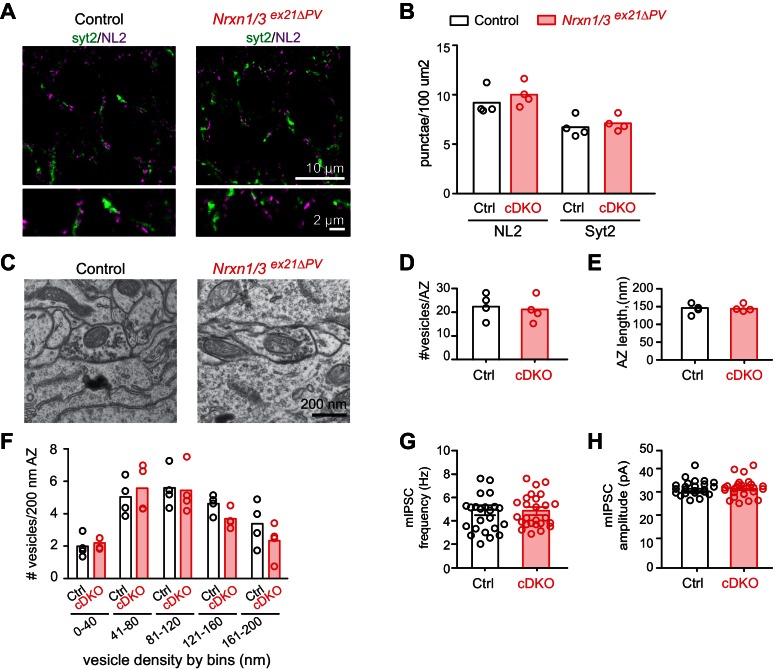
Figure 5. Analysis of PV+ specific Nrxn1/3ex21ΔPV conditional knock-out mice.

(A) The density of perisomatic GABAergic synapses in stratum pyramidale in CA1 of control and Nrxn1/3ex21ΔPV PV conditional double knock-out (cDKO) mice was examined by immunohistochemistry with anti-Neuroligin2 (NL2, in magenta) and anti-Synaptotagmin2 (Syt2, in green) antibodies at postnatal day 24–26. Note that Syt2 immuno-reactivity is specific for presynaptic terminals of PV+ cell synapses whereas NL2 is a common postsynaptic marker for most GABAergic synapses. Thus, only a fraction of NL2 puncta is apposed to Syt2-positive terminals. (B) The density of NL2 and Syt2 puncta per 100 μm2 of cell body area was quantified. Single dots in the graph represent means of respective synapse markers per animal (n = 4 mice per genotype). (C) Ultrastructure of inhibitory synapses in CA1 stratum pyramidale of littermate controls and Nrxn1/3ex21ΔPV mice. Presumptive PV+ cell perisomatic termini were identified by the presence of large mitochondria in the synapses apposed on the membrane of the soma and by their morphology (Takács et al., 2015). (D) Average vesicle numbers per active zone and (E) average active zone length in nm. Single dots in the graph represent means per animal (n = 4 mice for each genotype, ≥76 synapses). (F) Average number of vesicles located in 40 nm bins with increasing distance from the active zone normalized to 200 nm active zone length. Single dots in the graph represent means per animal (n = 4 mice for each genotype, ≥76 synapses). (G) mIPSC frequency and (H) amplitude in control and Nrxn1/3 ex21ΔPV mice. The recordings were performed in parallel with littermate controls. Single dots in the graph represent single cells (n = 3 control and 4 Nrxn1/3ex21ΔPV mice, mean ± SEM).

DOI: http://dx.doi.org/10.7554/eLife.22757.012

Figure 5.

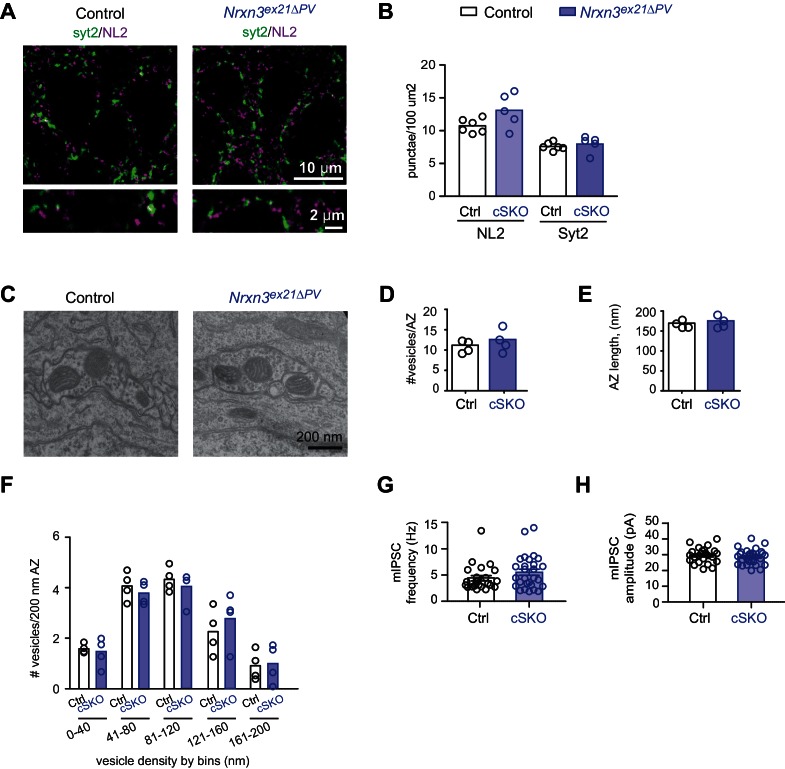
Figure 5—figure supplement 1. Analysis of PV+ specific Nrxn3ex21ΔPV single conditional knock-out mice.

Figure 5—figure supplement 1.

(A) The density of perisomatic GABAergic synapses in stratum pyramidale CA1 of control and single Nrxn1/3ex21 PV conditional knock-out mice (cSKO) was examined by immunohistochemistry with anti-Neuroligin2 (NL2, in magenta) and anti-Synaptotagmin2 (Syt2, in green) antibodies at postnatal day 24–26. Note that Syt2 immuno-reactivity is specific for presynaptic terminals of PV+ cell synapses whereas NL2 is a common postsynaptic marker for most GABAergic synapses. Thus, only a fraction of NL2 puncta is apposed to Syt2-positive terminals. (B) The density of NL2 and Syt2 puncta per 100 μm2 of cell body area was quantified. Single dots in the graph represent means of respective synapse marker per animal (n = 6 mice for control and five mice for Nrxn3ex21ΔPV). (C) Ultrastructure of inhibitory synapse in CA1 stratum pyramidale of littermate controls and Nrxn3ex21ΔPV mice. Presumptive PV+ cell perisomatic termini were identified by the presence of large mitochondria in the synapses apposed on the membrane of the soma and by their morphology (Takács et al., 2015). (D) Average vesicle numbers per active zone and (E) average active zone length in nm. Single dots in the graph represent means per animal (n = 4 mice for each genotype, ≥146 synapses). (F) Average number of vesicles located in 40 nm bins with increasing distance from the active zone normalized to 200 nm active zone length. Single dots in the graph represent means per animals (n = 4 mice for each genotype, ≥146 synapses). (G) mIPSC frequency and (H) amplitude in control and Nrxn3 ex21ΔPV mice. The recordings were performed in parallel with littermate controls. Single dots in the graph represent single cells (n = 7 control and seven conditional knock-out mice, mean ± SEM).
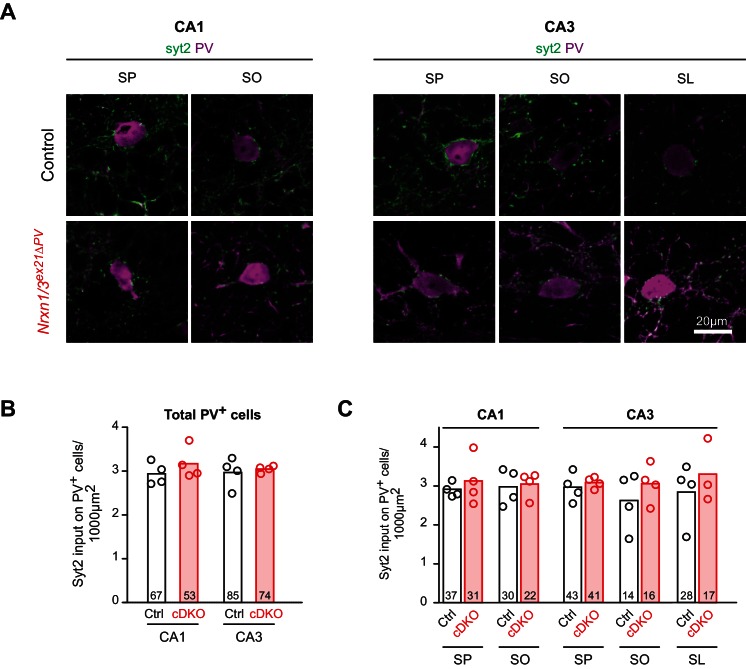
Figure 5—figure supplement 2. Quantification of PV+ synaptic termini on PV somata in the hippocampus.

Figure 5—figure supplement 2.

(A) The density of PV+ synaptic inputs onto somata of PV+ cell in control and Nrxn1/3ex21 PV+ cell specific knock-out mice was examined by immunohistochemistry with anti-Synaptotagmin2 (Syt2, in green) and anti-PV (in magenta) antibodies at postnatal day 24–26 in the CA1 and CA3. Moreover PV+ interneurons were also classified according to their laminar position (SP: stratum pyramidale, SO: stratum oriens, SL: stratum lucidum, mean). (B) Quantification of Syt2 inputs onto somata of PV+ interneurons in CA1 or CA3. Single dots represent means per animals (n = 4 mice for control and Nrxn1/3ex21 mice, the total number of PV+ interneurons is indicated in the graph bars, mean). (C) Quantification of Syt2 inputs onto same PV+ interneurons soma as in (B) which here are grouped according to their laminar position in the CA1 or CA3. Single dots represent means per animals (n = 4 mice for control and Nrxn1/3ex21 mice, the total number of PV+ interneurons is indicated in the graph bars, mean).