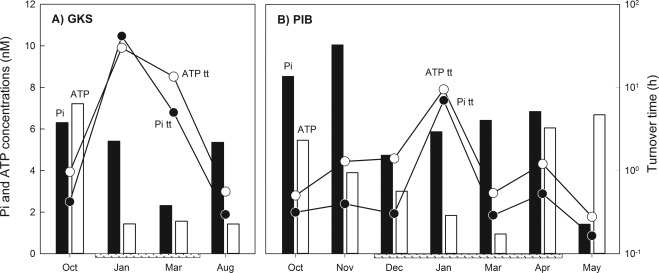
Figure 1.

Temporal dynamics of bioavailable Pi and ATP concentrations (black and light bars respectively) and the respective turnover times (tt) of Pi (filled circles) and ATP (open circles). The box underneath the x‐axis represents the ice‐covered period. Note that the y‐axis for turnover time is in logarithmic scale.
