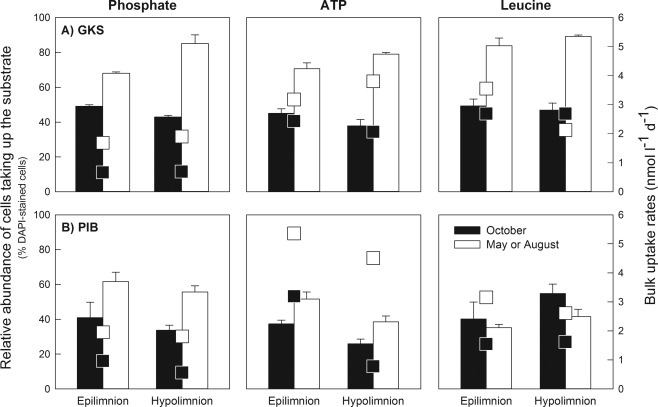
Figure 2.

Relative abundance of cells (% DAPI‐stained cells) taking up phosphate, ATP and leucine in the epilimnion and hypolimnion of GKS (A) and PIB (B). Filled bars represent October samples in both lakes. Open bars correspond to May and August samples in PIB and GKS respectively. Squared symbols indicate bulk uptake rates of the substrates in the respective month. Values are means of triplicate samples ± 1SD.
