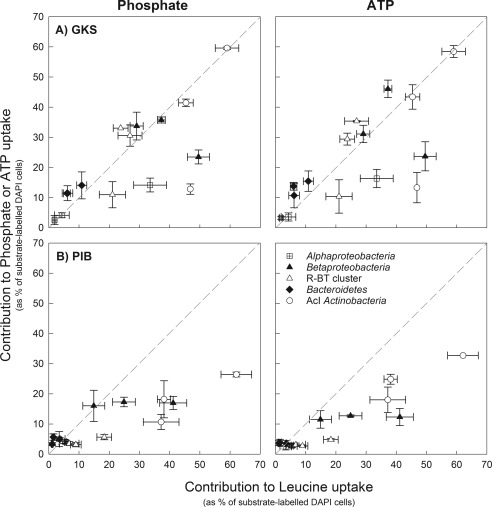
Figure 4.

Relative contribution of Alphaproteobacteria, Betaproteobacteria, R‐BT cluster of Betaproteobacteria, Bacteroidetes and AcI Actinobacteria to phosphate or ATP uptake plotted against their contribution to leucine uptake in GKS (A) and PIB (B). Mean values are given as % of substrate‐labelled DAPI cells ± 1SD. The dashed line indicates a 1:1 relationship. Samples were taken in October 2012 and in May (PIB) or in August 2013 (GKS). For October, epilimnion and hypolimnion values are pooled together (n = 5), whereas for May or August, values for both depths are plotted (n = 10).
