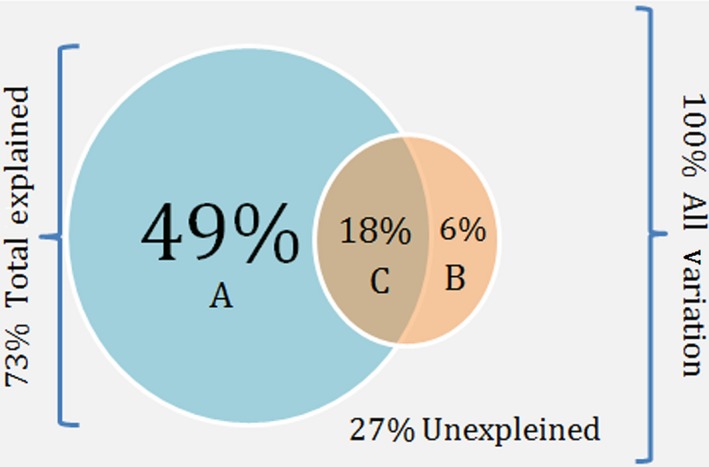
Figure 2.

Diagram from a partial canonical phylogenetic ordination (pCPO). Compared groups are represented by circles, and the letters represent individual estimated fractions. A, exclusive variance of phylogeny; B, exclusive variance of ecology; C, shared variance
