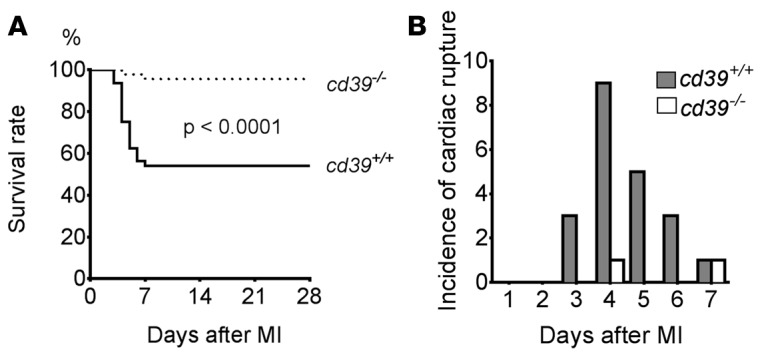
Figure 1. Survival of cd39+/+ and cd39–/– mice after myocardial infarction.

(A) Kaplan-Meier curve demonstrating survival of cd39+/+ and cd39–/– mice after permanent coronary occlusion (n = 46 for cd39–/– mice and n = 48 for cd39+/+ mice). Log-rank. (B) Incidence of cardiac rupture after myocardial infarction (MI). Genotype is indicated.
