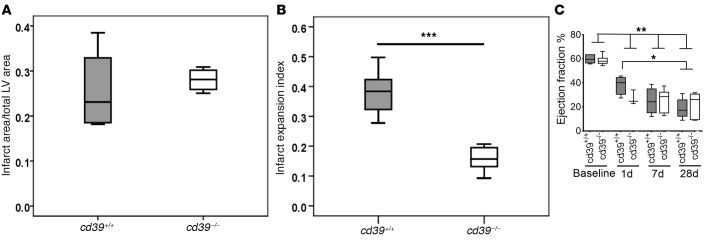
Figure 2. Myocardial infarct size and expansion and left ventricular systolic function.
(A) Infarct size was evaluated by TTC staining of 1-mm left ventricular (LV) cross sections 24 hours after permanent coronary occlusion. There was no difference in infarct size between cd39+/+ and cd39–/– mice. n = 4 per group. (B) Greater infarct expansion was seen in cd39+/+ mice in comparison with cd39–/– mice. Expansion index = (LV cavity area/total heart area) × (uninfarcted septal thickness/infarcted LV free wall thickness). n = 5–6 per group. Student’s t test. (C) Assessment of LV systolic function. Echocardiographic data for cd39+/+ and cd39–/– mice after myocardial infarction are shown. n = 6–7 per group, except for day 1, n = 3–4 per group. 1-way ANOVA, *P < 0.05 **P < 0.005, ***P < 0.001. Box and whisker plots show median (line within box), upper and lower quartiles (bounds of box), and minimum and maximum values (bars).

