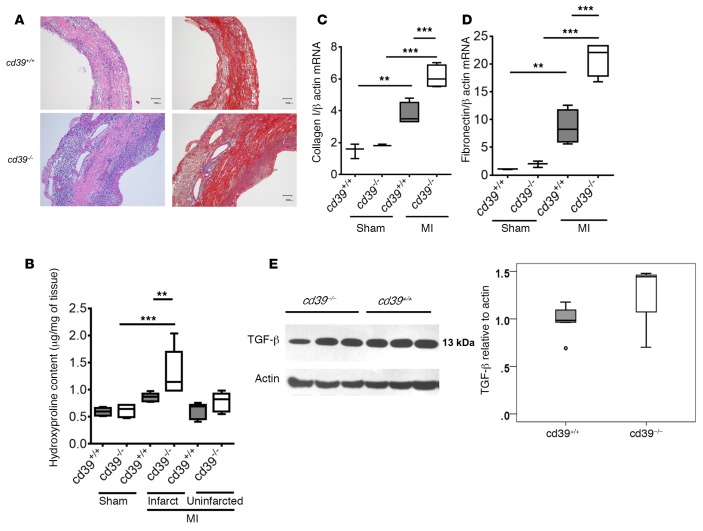
Figure 4. Healing after myocardial infarction.
(A) Histological analysis of infarcted myocardium in cd39+/+ and cd39–/– mice; H&E (left) and Masson’s trichrome (right) staining 4 days after myocardial infarction (MI). Scale bar: 200 μm. (B) Hydroxyproline content in sham-operated myocardium and in the infarcted and uninfarcted regions of myocardium from mice with MI 4 days prior. n = 4–5 mice per group. 1-way ANOVA. (C) Collagen I and (D) fibronectin gene expression 4 days after MI. n = 3–4 per group. 1-way ANOVA. (E) TGF-β expression was evaluated in the infarct and peri-infarct regions 48 hours after MI in cd39+/+and cd39–/– mice using Western blot. TGF-β expression did not differ between the two groups. n = 3–5 per group. Student’s t test, **P < 0.001, ***P < 0.0001. Box and whisker plots show median (line within box), upper and lower quartiles (bounds of box), and minimum and maximum values (bars).

