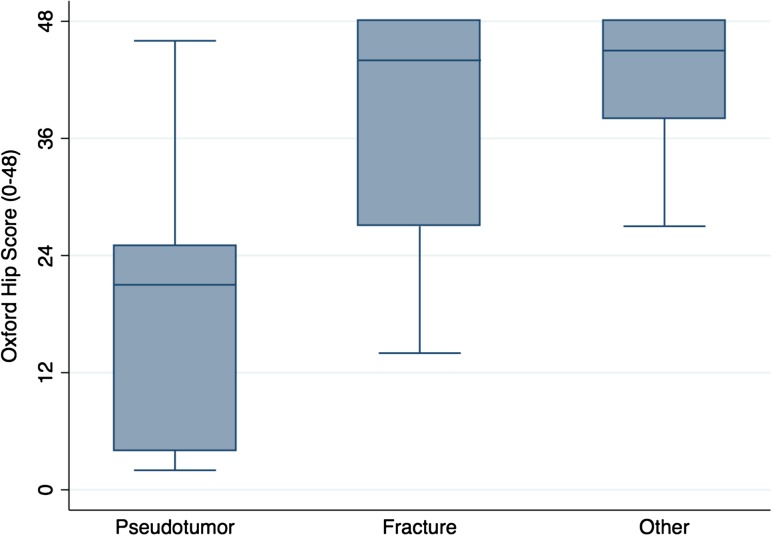
Fig. 3.
A box and whisker plot of the OHS after revision hip resurfacing by initial revision indication is shown. The horizontal line within the box is the median. The two ends of each box represent the 25th and 75th percentiles and the difference between these values is the interquartile range (IQR). The whiskers extending from the box represent the most extreme data points, which are no more than 1.5 times the IQR from the 75th percentile (upper whisker) and no less than 1.5 times the IQR from the 25th percentile (lower whisker). Values lying outside of the whiskers represent outliers.

