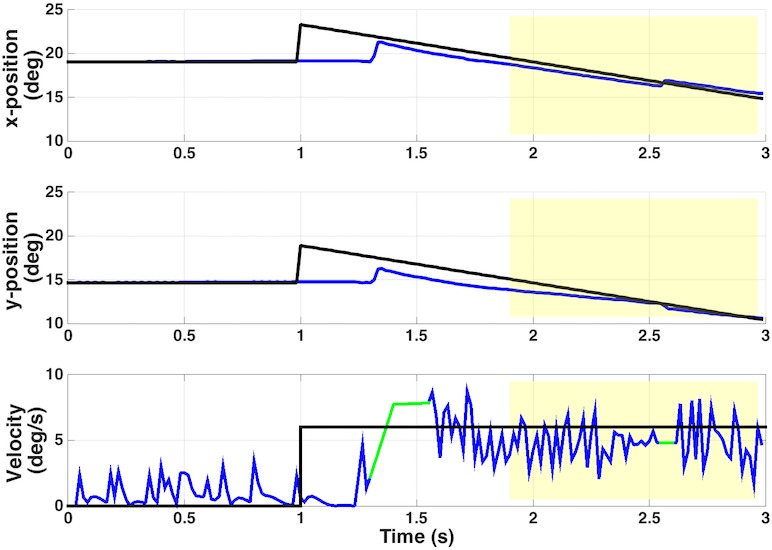
Figure 2.

Typical smooth pursuit trial, participant P1. Top two panels illustrate target (black) and eye (blue) horizontal and vertical position for a 0.6° target moving in a 135° trajectory. Yellow shading represents the period of continuous velocity used to calculate gain for this trial. Bottom panel illustrates target and eye velocity for the same trial. Green intrusions are regions where a saccade was removed and velocity interpolated.
