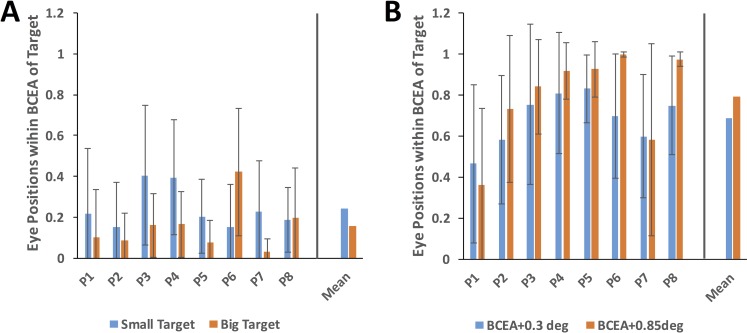
Figure 4.
Proportion of eye positions on (A) target center (within BCEA of center) and (B) on any part of target (within the BCEA of target perimeter) during smooth pursuit. Blue bars are data for small (0.6°) target trials, and orange bars are data for large (1.7°) target trials. Error bars are one standard deviation of the mean. Group means are shown as the rightmost bars for each plot.

