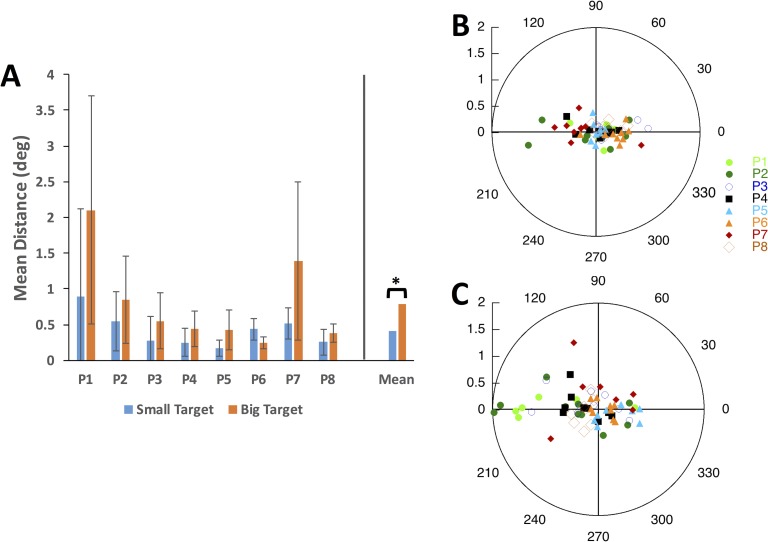
Figure 5.
Mean eye distance relative to the center of the target during smooth pursuit (A). Asterisk indicates a significant difference in eye–target distance for small (0.6°) and large (1.7°) targets (p = 0.047). Error bars are one standard deviation of the mean. Group means are the rightmost set of bars. Distribution of average eye positions relative to the target (crosses in Figure 3) during smooth pursuit for 0.6° (B) and 1.7° (C) targets. For all trials, eye positions have been rotated such that they lie along the horizontal axis, with target center at the origin, and the direction of motion leftward.

