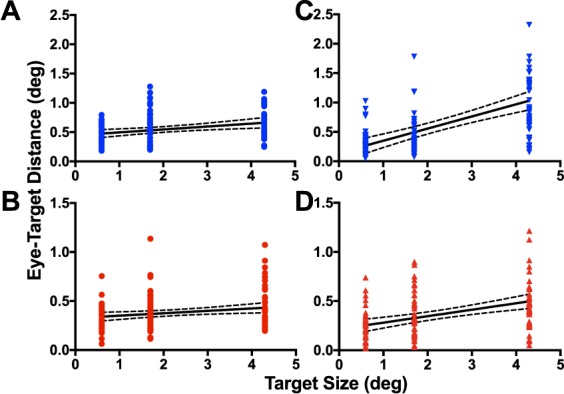
Figure 7.

Distribution of eye–target distances for participants P1 (A & C) and P3 (B & D) for saccade (A & B) and smooth pursuit (C & D) trials. Each symbol represents an individual trial. Solid black lines are the linear regression fit. Dashed lines indicate the corresponding 95% confidence intervals for the regression.
