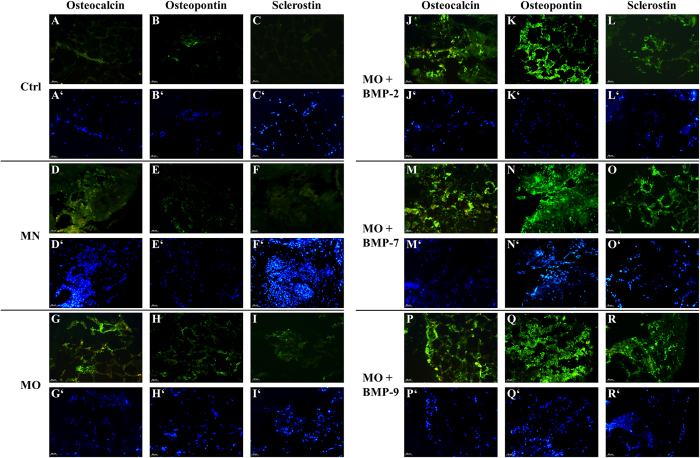
Figure 6. Histological sections of fat cultures after 4 weeks under various differentiation conditions.
Immunofluorescence for OCN, OPN and Scl is shown in green. Control (Ctrl) samples (A–C) represent the untreated fat fragments. Samples treated with MN are shown in the images (D–F); MO at (G–I); MO + BMP-2 in (J–L); MO + BMP-7 in (M–O); MO + BMP-9 in (P–R). Nuclei of cells (blue) are shown in the corresponding images (A’–R’). Scale bar = 50 μm.

