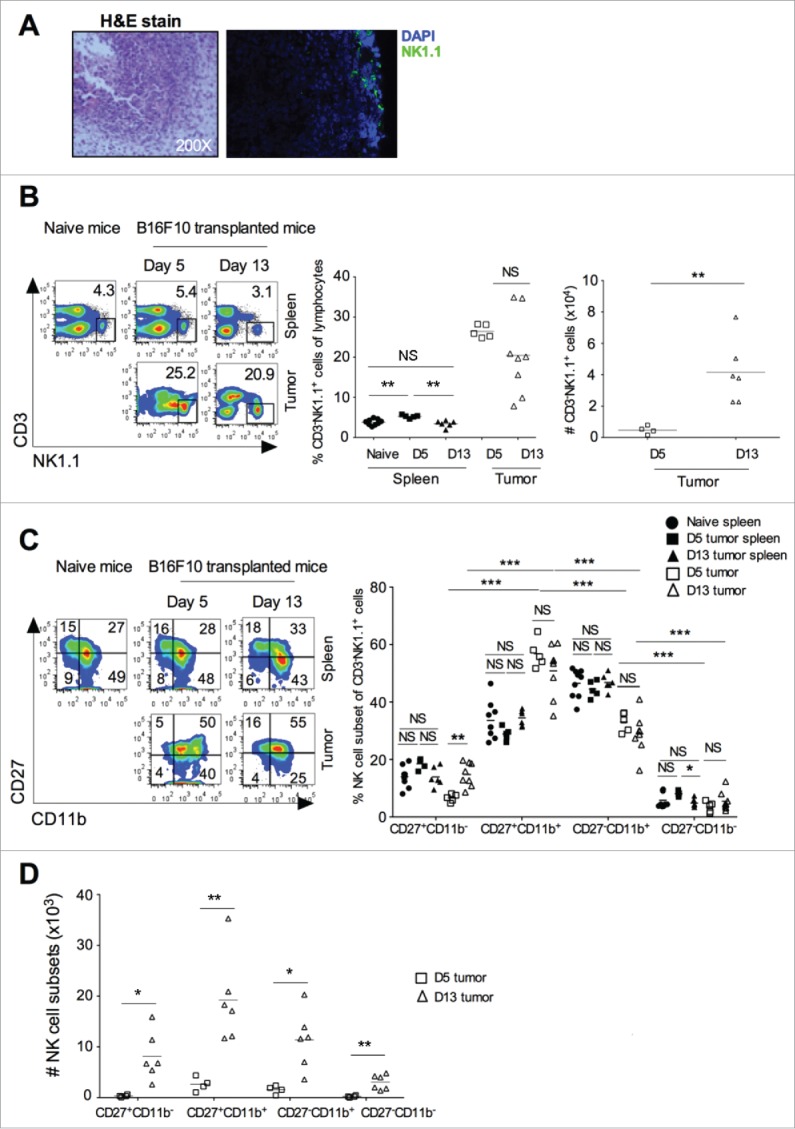
Figure 1.

B16F10 induced tumor showed early recruitment of NK cells. B16F10 cells (1×10⁶ cells/mouse) were s.c. injected in the naive C57BL/6 mice. (A) At day 13, tumor was harvested, representative H&E staining is shown (left), and a representative image of NK1.1+ NK cells staining in the tumor shown (right). (B) Tumor and spleen was harvested at days 5 and 13 after B16F10 injection, and CD3−NK1.1+ cells were analyzed after gating on lymphocytes and singlet population using flow cytometry (left). Numbers indicate the percentage of cells in the gated region. Mean percentage of NK cells in the spleen and tumor were plotted (middle). The absolute number of CD3−NK1.1+ cells was calculated and plotted (right). Data are representative of 2-5 independent experiments. (C) Based on CD11b and CD27 staining, NK cell subsets were analyzed by flow cytometry after gating on CD3−NK1.1+ cells (left). Mean percentage of indicated NK cell subsets were plotted (right). (D) The absolute numbers of NK cell subset in the tumor at day 5 and day 13 were counted and plotted. From (B)–(D), the bars represent mean and each dot represents an individual mouse (n = 5–9 mice/group for naive and day 5, and n = 6–8 mice/group for day 13; one-way ANOVA followed by Tukey's post hoc analysis). Data are representative 2-5 independent experiments. In all panels, *p < 0.05; **p < 0.01; NS, not significant.
