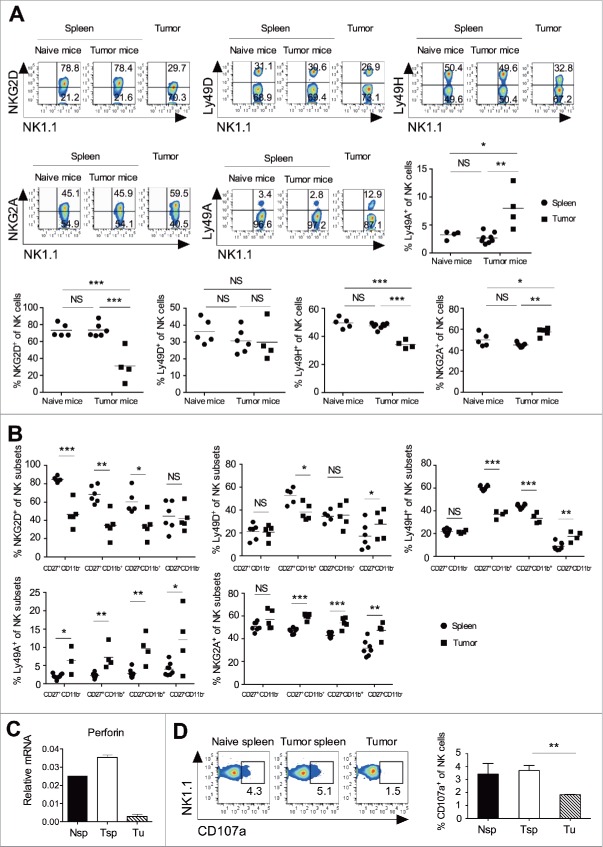
Figure 3.
Tumor infiltrating NK cell display an altered expression of activating and inhibitory receptor and impaired cytolytic function. B16F10 cells (1×10⁶ cells/mouse) were s.c. injected in the naive C57BL/6 mice. (A) At day 13, spleen and tumors were harvested, and frequencies of NKG2D, NKG2A, Ly49D, Ly49H, and Ly49A expression on CD3ε−NK1.1+ cells were analyzed using flow cytometry. Numbers in each region represent percentage of cells. The bar represents mean and each dot represents an individual mouse (n = 4–8 mice per group; one-way ANOVA followed by Tukey's post hoc analysis. (B) At day 13, the frequency of NKG2D, NKG2A, Ly49D, Ly49H, and Ly49A on the indicated of NK subsets were analyzed after gating on CD3−NK1.1+ cells using flow cytometry. The bar represents mean and each dot represents an individual mouse (n = 4–8 mice; Student's t-test). (C) At day 13, CD3−CD49b+ NK cells were purified from pooled naïve mouse spleen (Nsp), tumor bearing mouse spleen (Tsp) and tumor (Tu) using flow cytometry sorting. Perforin mRNA expression was analyzed using qRT-PCR. Data shows the Mean ± SD of duplicate wells, and data are representative of two independent experiments. (D) At day 13, NK cells were purified from pooled spleen and tumor using flow cytometry sorting, and degranulation of NK cells against B16F10 tumor cells were performed as described in materials and methods. The numbers represent the percentage of cells in the region. Mean ± SEM shown, n = 3 independent experiments. In all the panels, *p < 0.05, **p < 0.01, ***p < 0.001, NS, not significant.

