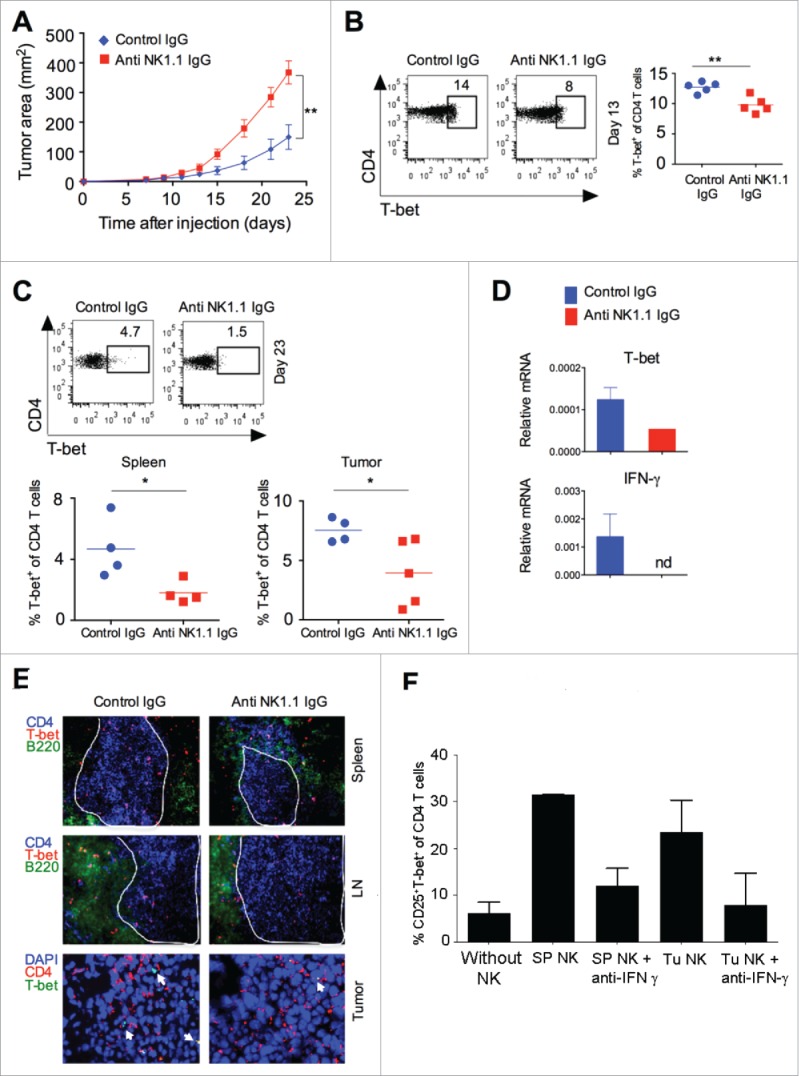
Figure 5.

NK cell depletion affects T cell differentiation and result in increased tumor growth. B16F10 cells (1 × 10⁶ cells/mouse) were s.c. injected in the naive C57BL/6 mice, and NK cells were depleted by i.v injection of NK1.1 mAb (PK136; 100 μg/mouse/injection) or isotype control IgG2a on days −3, +1, +4, +9, +14 and +19 with respect to tumor cell injection. (A) Tumor growth was monitored and plotted (n = 4–5 mice/group; Student's t-test, *p < 0.05; **p < 0.01). (B) At day 13, CD4+T-bet+ T cells (Th1) in the spleen were analyzed after gating on CD4+ cells using flow cytometry (left panel). The numbers represent percentage of cells in the region. The mean percentages of CD4+T-bet+ T cells (Th1) are plotted (right panel). The bar represents mean and each dot represents an individual mouse. (C) At day 23, CD4+T-bet+ T cells (Th1) in the spleen and tumor were analyzed after gating on CD4+ cells using flow cytometry (upper panel). The numbers represents percentage of cells in the region. The mean percentages of CD4+T-bet+ T cells (Th1) in the spleen and tumors are plotted (bottom panel). The bar represents mean and each dot represents an individual mouse. (D) At day 13, CD4+ T cells were purified from tumor using flow cytometry. T-bet and IFNγ mRNA expression was analyzed using qRT-PCR. Bar graph represents the expression of the indicated gene relative to GAPDH. Data shown are the Mean ± SD; nd, not detected. (E) At day 23, CD4+T-bet+ T cells (Th1) in the spleen, lymph nodes (LN) and tumors were analyzed by immunohistochemistry. Original magnification 400× for spleen and LN; and 630× for tumor. White line indicates CD4+ T cell zone in spleen and lymph node tissues. White arrow in the tumor tissue indicates T-bet+ cells. (F) Naive CD4+ T cells (5 × 10⁴ cells/well) were cultured with purified splenic or tumor NK cells (2.5 × 10⁴ cells/well) and irradiated T cell depleted syngeneic splenocytes (5 ×10⁴ cells/well) along with recombinant IL-2 (20 ng/mL) and anti-mouse CD3ε (5 μg/mL) in the presence or absence of anti-IFNγ mAb (10 μg/mL) for 4 d at 37°C in U-bottomed 96 well plates. Expression of T-bet was analyzed after gating on CD4+ cells by flow cytometry. The mean percentages of cells were plotted and error bas represent SEM; n = 2 experiments (Student's t-test, *p < 0.05; **p < 0.01).
