
Figure 4.
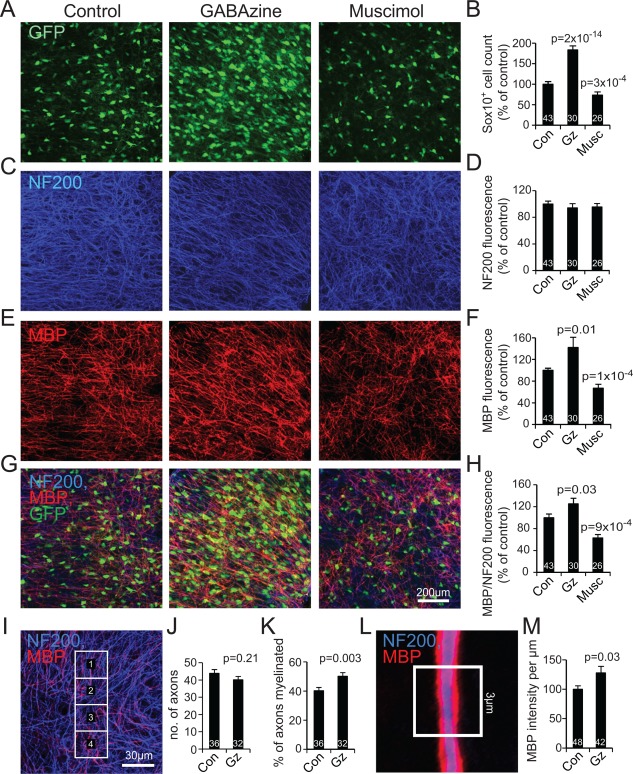
Endogenous GABA release decreases myelination. A, C, E, G: Cortical slices at DIV14 after culture in control conditions, or with GABAzine or muscimol present from DIV3‐14, showing labeling for (A) Sox10‐GFP, (C) neurofilament (NF200), (E) MBP and (G) all the labels. B, D, F: Quantification (averaged over the whole image) of the labeling in the panels to the left (panel B is similar to the 1st, 3rd, and 4th bars in Fig. 2B but using data only for the slices from which panels D, F, and H were obtained; numbers on bars are total number of slices from 7 experiments using 2 or 3 animals each). H: Ratio of labeling for MBP to that for NF200. I: Specimen labeling with superimposed squares for quantification of the fraction of NF200‐expressing axons (blue) that are myelinated (i.e., wrapped with MBP, red). J‐K: Effect of GABAzine from DIV3‐14 on the number of axons present per rectangle (J) and the percentage of axons myelinated (K); numbers are total number of areas from 8 slices, in 2 experiments with 3 mice each. L: Specimen image of myelinated axon, with 3 μm long region of interest used to quantify the amount of MBP per micron of axon. M: Effect of GABAzine on MBP fluorescence intensity per micron of axon. Numbers on bars are total number of axons in 8 slices, from 2 experiments using 3 mice each.