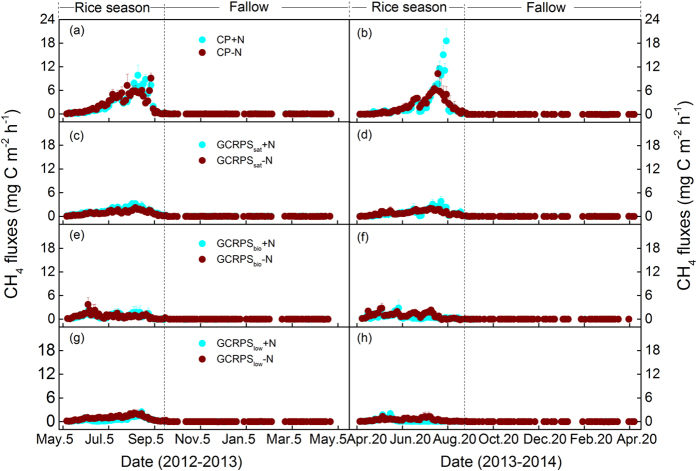
Figure 1. Seasonal variations of methane (CH4) fluxes for different rice cultivation practices fertilized using two nitrogen application rates during the period of 2012–2014.
Vertical bars indicate the standard errors of three replicates. The legends in panels (a), (c), (e) and (g) also apply for the panels of the same row, respectively. Definitions of the treatment codes are referred to the footnotes of Table 1 and the text.

