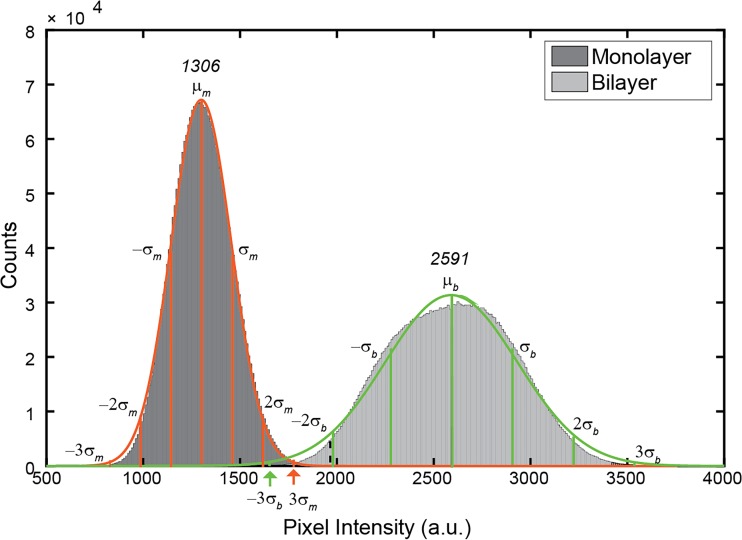
Fig 4. Histogram of pixel intensities of lipid bilayers on ox-PDMS and lipid monolayers on PDMS.
Each histogram is obtained from N = 10 images, corresponding to a total count of ~ 2.6 × 106 pixels per histogram. The orange continuous line is a fit of a normal distribution to the histogram for the monolayers. The green continuous line is a fit of a normal distribution to the histogram for the bilayers. The mean intensity of the monolayer, μm = 1360 is half the mean intensity of the bilayer, μb = 2591. The histogram of pixel intensities between the bilayers and monolayers do not overlap up to ~ 2.5σ from the mean. The clear separation of the distribution of pixel intensities allows classification of pixels as being monolayers or bilayers in images that potentially have mixed compositions of monolayers and bilayers.

