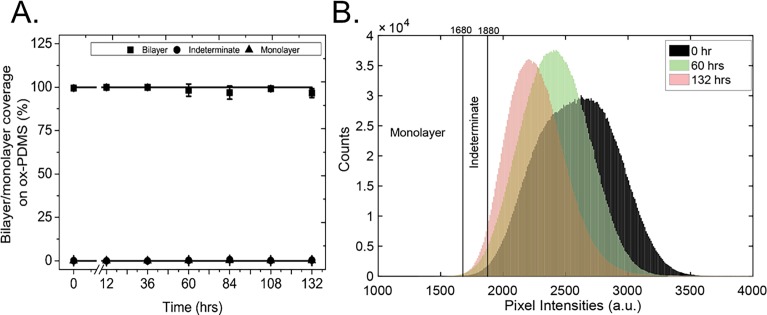
Fig 5. Quantification of the evolution of lipid bilayers on ox-PDMS as a function of time.
A) The normalized area fraction of pixels with intensities consistent with lipid bilayers are represented by solid squares (■), the normalized area fraction of pixels with intensities consistent with lipid monolayers are represented by solid triangles (▲), and the normalized area fraction of pixels with indeterminate intensities are represented by solid circles (●). Standard deviations of the mean are represented by the corresponding error bars. The area fraction of bilayer was close to 100 percent for the duration of the 132-hour experiment. B) Plot of the histogram of pixel intensities (from N = 10 images at each time point) of lipid layers on ox-PDMS at 0 hours, 60 hours, and 132 hours after preparation. The peak of the distribution shifts with time signifying that the layer as a whole becomes less bright. The distributions show a longer right tail. The combination of movement of the peak of the distribution towards lower values and the development of a right tail should result in regions that are brighter when compared to the background, i.e. the mottled appearance of the layer. Note however, that the majority of pixels had intensities consistent with bilayers. The number of pixels classified as indeterminate increases slightly, and none of the pixels had intensities consistent with monolayers.

