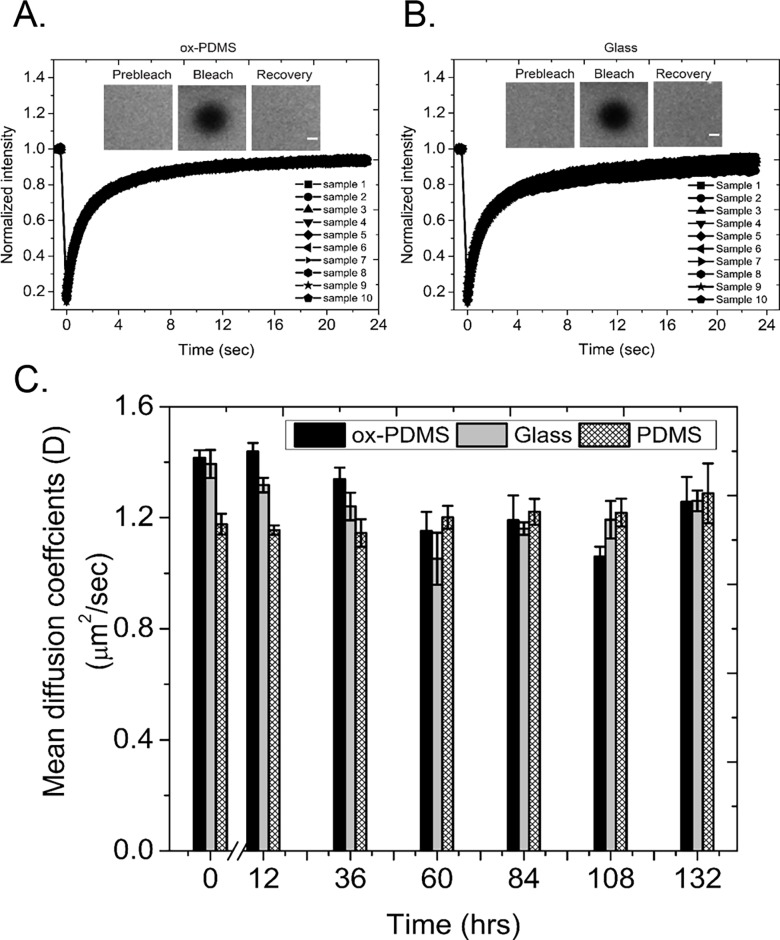
Fig 6. Measurement of the diffusive mobility of lipids on the lipid layers.
Plot of the fluorescence recovery curves on, A) ox-PDMS, and B) glass, immediately after preparation of the lipid bilayers. Each plot shows recovery curves from FRAP measurements on ten different locations. The recovery curves are highly reproducible. Insets are representative images before the bleach pulse, the first image after the bleach pulse, and the final image of the time series at 24 seconds. Scale bars 2 μm. C) Plot of the diffusion coefficient versus the time since preparation of the lipid layer. The black bars are for the bilayers on ox-PDMS, the gray bars are for bilayers on glass, and the cross-hatched bars are for monolayers on native PDMS. The diffusion coefficient does not change significantly for the lipid monolayers over the course of 132 hours. The diffusion coefficient of the lipids in the bilayer on ox-PDMS and glass were similar and higher than the diffusion coefficient of the lipids in monolayers on native PDMS for the first 36 hours. The diffusion coefficient however, dropped by 20 percent at 60 hours and then matched those of the lipid monolayers prepared on PDMS. Each bar is a mean of N = 10 measurements. The error bars are standard deviations of the mean.

