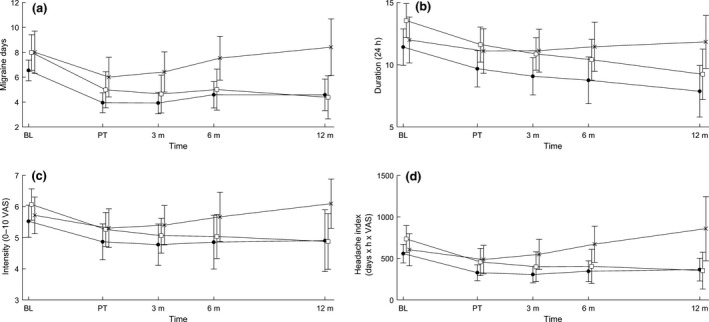
Figure 2.

(a) Headache days; (b) headache duration; (c) headache intensity; (d) headache index. Time profiles in primary and secondary end‐points, means and error bars represent 95% confidence intervals. BL, baseline; control, control group (×); CSMT, chiropractic spinal manipulative therapy (●); placebo, sham manipulation (□); PT, post‐treatment; 3 m, 3‐month follow‐up; 6 m, 6‐month follow‐up; 12 m, 12‐month follow‐up; VAS, visual analogue scale.
