
Figure 1.
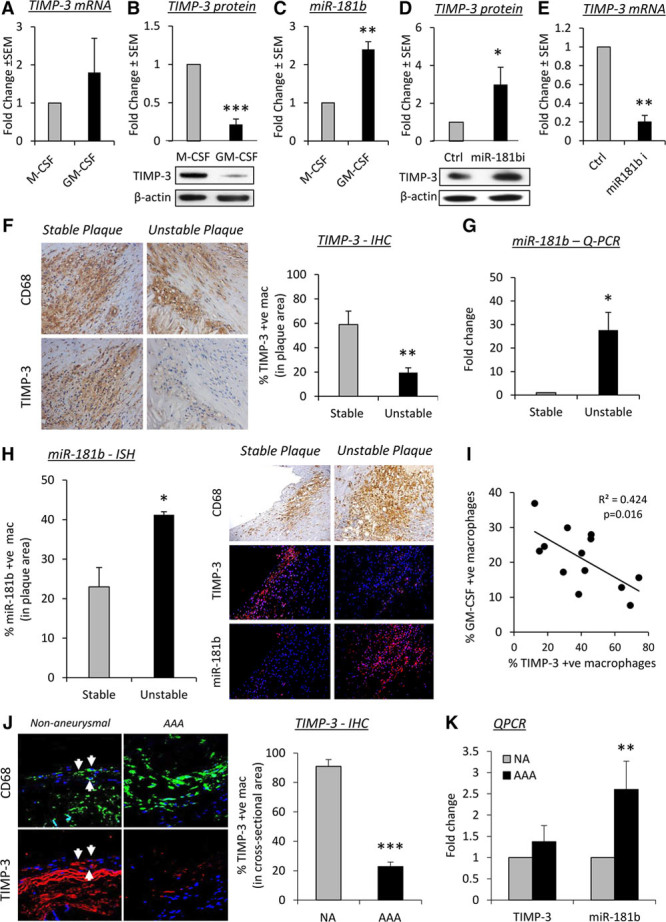
MicroRNA (miR)-181b regulates macrophage tissue inhibitor of metalloproteinase (TIMP)-3 expression and associates with cardiovascular disease progression in humans. A, Quantitative polymerase chain reaction (QPCR) and (B) Western blot of TIMP3 mRNA and protein expression, respectively, in human macrophages differentiated in the presence of macrophage colony-stimulating factor (M-CSF) or granulocyte/macrophage colony-stimulating factor (GM-CSF), n=6/group, ***P<0.001, 2-tailed Student t test. C, QPCR of miR-181b in human macrophages differentiated in the presence of M-CSF or GM-CSF, n=6/group, **P<0.01, 2-tailed Student t test. D, Western blot and (E) QPCR of TIMP3 in 7-day GM-CSF–differentiated macrophages after addition of an miR-181b inhibitor (miR-181bi) or a scrambled control (Ctrl), n=4/group, *P<0.05 and **P<0.05, 2-tailed Student t test. F, Representative images of CD68 (macrophages) and TIMP-3 protein expression by immunohistochemistry (IHC) and quantification from human stable and unstable coronary atherosclerotic plaques, n=10/group, **P<0.01, 2-tailed Student t test. G, QPCR of miR-181b expression from stable and unstable coronary atherosclerotic plaques, n=10/group, *P<0.05, 2-tailed Student t test. H, Representative images and quantification of TIMP-3 protein expression by IHC and miR-181b by in situ hybridization (ISH) from stable and unstable coronary atherosclerotic plaques, n=10/group, *P<0.05, 2-tailed Student t test. I, Correlation of TIMP-3 and GM-CSF–positive macrophages in human coronary artery atherosclerotic plaques, n=16, Spearman correlation test. J, Representative images of CD68 (macrophages) and TIMP-3 protein expression by IHC and quantification from control human nonaneurysmal (NA) aorta and abdominal aortic aneurysm (AAA), n=10/group, ***P<0.00315, 2-tailed Student t test. K, QPCR of TIMP-3 and miR-181b expression from control human NA aorta and AAA, n=10/group, **P<0.01, 2-tailed Student t test. In all cases, data represent the mean±SEM.